dbnet.home Bookmark and Share
banner_commercial.jpg

Energy Economics

The Energy Complex is complicated and affected by many factors including politics, weather, and economic conditions among others. It's a closed-loop system besides: energy markets reflexively affect these factors (politics and economics, at least).

For reasons of both physics and logistics, most economies are highly dependent on carbon-based energy sources. Petroleum supply has become constrained within large regions of the world, with countries and regions becoming net importers or exporters. It is arguable that oil production peaked worldwide in the past decade, and US oil production demonstrably peaked during the 1970s. As regions have become dependent on each other as supplier or consumer, supply of energy is now a worldwide issue. We can't realistically discuss US energy/economic/climate policy, for example, without considering global interactions.

In the US, politically-driven initiatives have been undertaken to shift energy sources and use to renewable sources such as wind and solar power. A specific objective of current legislation is to rapidly reduce use of carbon sources including petroleum, coal and natural gas. Over 80% of US energy use today comes from petroleum, coal and natural gas and it seems unlikely that such a shift is executable in the political timeframe. There is significant debate on whether this is even advisable given the economic effects. There might be realistic alternatives involving nuclear, natural gas, and evolution of coal, that are more realistic and have more acceptable economic consequences. However, these alternatives have not been organized into championed proposals at the national level.

puzzle_incomplete.gif

Current US public discussion on the topic of energy is driven around climate change and that case has been broadly and deeply argued. Sadly, the energy industry has been woefully inadequate and ineffective in representing to the public the state of energy supply and world competition and outlook. To the contrary, public perception is driven by incomplete information skewed to immediate-term, distorting the picture.

Additionally, political interests further distort the information to their own advantage. As a result, overall public opinion more likely favors climate protection and resents big business entities that are portrayed as "polluters". Kind of a crab behavior. This is unfortunate, because both climate and sourcing are important to address.

Note that most energy supplies in the world today are nationalized. Even the giant oil companies are actually small players in the overall scheme. In 2007, around the world government-controlled companies controlled 52% of production and 88% of proven reserves.

Energy Return on Investment

Energy Return on Energy Invested is explored by David Murphy of SUNY, who provides estimates of EROEI for many energy sources. (as well).

eroei.png
  • Carbon sources
    • Coal: 80
    • Oil: 11 to 18
    • Natural gas: 10
    • Shale oil: 5
    • Tar sands: 2 to 4
  • Non-carbon sources
    • Hydroelectric: >100
    • Wind: 18
    • Nuclear: 5 to 15
    • Solar PV: 6.8
    • Solar thermal: 1.6
  • Biomass
    • Cane ethanol: 0.8 to 10
    • Corn ethanol: 0.8 to 1.6
    • Biodiesel: 1.3

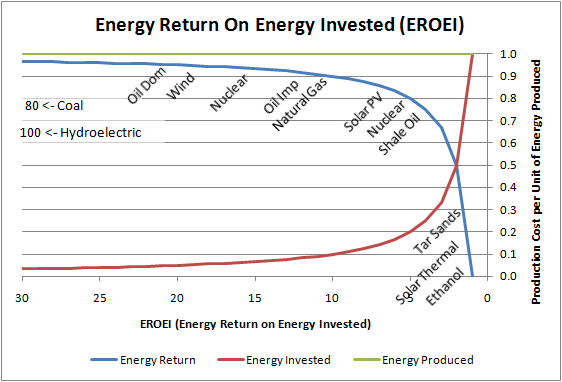
These EROEIs do not include inefficiencies due to thermodynamics, inversion, or use; but do include costs for production, refining, and transport or transmission as required per source. These are energy return on investment, not cost return on investment. However, cost return on investment is partially a function of EROEI of the energy source.


(14 Apr 2009) Discussion by Charles Hall, State University of New York College of Environmental Science and Forestry, on provisional assessment of EROEI for many energy sources. The article observes continued decline of EROEI within and across sources, and discusses minimum EROEI needed for industrialized economies. One conclusion is that few alternative energy sources have the EROEI necessary to act in a meaningful way as replacement fuels for oil and gas without significant cost reduction. (Note that this article links to several other articles also on the subject of EROEI or Net Energy.) An update to the paper "What is the Minimum EROI that a Sustainable Society Must Have?", discussed here, concludes that for a system to survive it must realize minimum EROEI of 3:1. Fuels providing EROEI less than that, must be subsidized by fuels yielding greater EROEI. (Note that there are multiple "ROI" metrics around energy economics (return on energy, return on investment et al.), and that their acronyms are frequently interchanged in literature. Dr. Hall's paper uses the acronym "EROI" to refer to the metric referred to as EROEI elsewhere on this website.) Specific points made in the paper include:

  • Energy decisions made in the present based on market economics may be insufficient. Current prices are unlikely to be influenced by future conditions in which fuels most abundant today become less available or more expensive. Current prices are greatly influenced by subsidies, and availability of "cheap oil" may become limited.
  • EROEI is generally stated at the wellhead, mine mouth etc., and does not include conversion, inversion, transmission et al. Various EROEI metrics are proposed to to provide metrics at several points including total EROEI within an economic system.
  • The amount of energy required to produce a unit of energy from a given source (the denominator of the EROEI expression) is not generally well-understood. The result is likely common over-statement of EROEI.
  • It is not only net energy that is important to a system. Power, which is rate of energy use per unit time, is important to a viability of a system. Power defines "lifestyle" of a system and must be available in sufficient quantity to not just survive, but to grow, propagate, replace depreciation, etc. Available power is key to outcome of competition among systems in both a biological and economic sense.
  • Economic cost of energy is the total cost of all energies as a fraction of GDP of a system. In the US in 2007 this was roughly 9%. Variation of this cost comes out of the approximately 25% of GDP available for "discretionary" spending, so economic impact of energy cost variation may be large.
  • Fossil fuels have provided high EROEI to society (consistent with EROEI data quoted from other sources on this webpage). However, these fuels are being depleted in a race with technology to continue to provide energy. Based on time-analysis of EROEI of oil and coal, depletion has overtaken technology and costs have risen. This argues for substitute fuel development sooner rather than later.
  • Substitute fuels lack some desirable traits of fossil fuels including energy density, transportability, EROEI, and scalability sufficient to meet demand.
  • When costs of production, delivery, transport and use are included, EROEI of the US economy is about 3:1, based on "wellhead" EROEI of 10:1. Minimum wellhead EROEI is postulated as 3:1.

Technology Total Annualized $/Mwh
Coal: Pulverized $63.10
Coal: IGCC $82.99
NG: Combined Cycle $61.77
Nuclear $83.22
Wind $80.74
Geothermal $59.23
Solar: Thermal $100.32
Solar: Photovoltaic $255.41

CRS Report for Congress, Power Plants: Characteristics and Costs by Stan Kaplan provides more in-depth financial analysis of power generation by primary and alternative fuels. The report provides a "base case", to which it then applies various government financial variations and carbon control costs. The base case illustrates intrinsic costs of power generation and roughly supports the EROEI figure above. Comparison of fuels, base case (from Table 4, page CRS-39):

(6 Apr 2010) Further information on electricity generation cost from EIA Electricity page, and EIA Electricity Market Module.

(30 Dec 2010) An article Renewable and fossil electricity generation costs compared, at The Oil Drum.
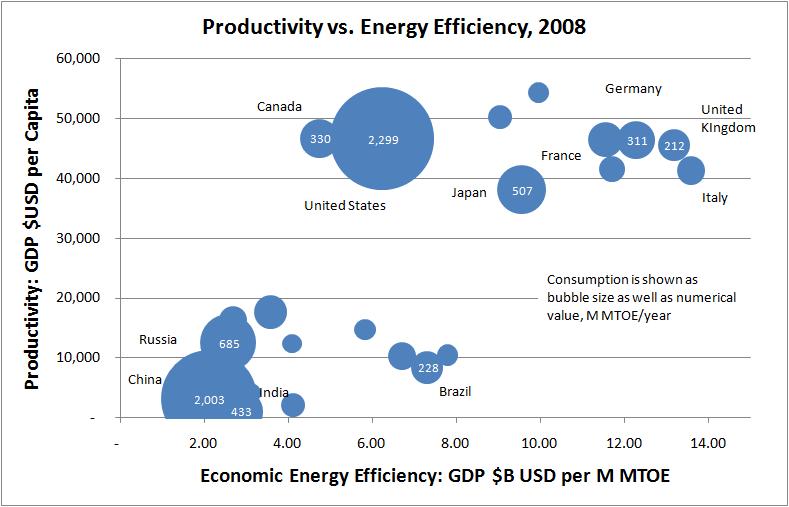

chu_energydensity.jpg(13 Apr 2010) A chart presented by Dr. Steven Chu, US Secretary of Energy at an EIA/SAIS Energy Conference April 2010 illustrates current comparative energy densities.


Some Basic Economics

(6 Apr 2010) There are of course zillions (technical economic term) of sources on economic theory and many readers of this site are already familiar with the topic. Nevertheless, here is a timely article at Seeking Alpha by John Mauldin, that describes the connections among nominal gross domestic product, money supply, and velocity of money. The article is timely in that it connects these to the observed economics of the crisis we are experiencing in 2009/2010.

A quick summary of theory (with some interpretation to map to this site). First, by the Quantity Theory of Money, PQ = MV, meaning that nominal gross domestic product (sum value of all national transactions (transaction prices P * transaction costs Q)) = money supply times velocity of money (which is number of times per period that a given unit of money is spent). Financial "innovation", in the form of CDOs etc., leading up to 2009 increased spending rate V although money supply M during that time was falling, ultimately leading to a crisis in credit. We are now experiencing the unwind of those innovations, and V has declined significantly driven in part by the initial panic. To maintain P, the governments have pumped large amounts of money M in the economies - so as a result, GDP has experienced limited decline. And of course governments accomplish infusion of money by spending to further their agendas (for example, redistributing wealth), hence driving political disruption.

As a result, corporations now have large amounts of money on hand. At lower employment rates, this increases productivity and debt-to-equity metrics, driving up equity markets and ultimately leading to increased investment in capital. At that point the Fed will have to take money out of the system by raising rates, to avert inflation. The intent is that all this will lead to economic recovery.

But this remains balance-sheet recovery driven by monetary policy, rather than recovery in actual production of goods. Significant production capacity remains idle, lending rates remain low (V), and housing inventory remains high. Disagreement, expressed in political positions, remains on economic recovery via balance-sheet repair, versus production recovery.

Energy Usage, GDP, and Efficiency

GDP (Gross Domestic Product) is the sum of the value of final market goods and services for domestic consumption plus gross investment plus government spending plus the net of trade, exports minus imports. As such, it is something of a measure of economic performance. It is not a perfect measure, but it is commonly available and is tracked and updated frequently using commonly accepted definitions so it is generally comparable. A probably large effect is that GDP does not include subsistence production, i.e. goods produced for immediate consumption without involving any form of trade, domestic or regional.

(Credit: /r/dataisbeautiful blacktiger226)

The animation above compares GDP of countries over time ranked from largest to smallest, giving an interesting comparison of relative and fluctuating economies. In particular, during the timeframe shown the largest GDP is the USA. Given the economics of the period around 2018 it is interesting to note the rise of the GDP of China in comparison to the USA. The GDPs of the European countries are compared also in this way among each other. It would have been instructive if there were included a GDP aggregating the EU member states which would then portray the EU as an economy comparable to the USA and to China. The animation gives the impression of the US massively dominating world economics which is part of the story, but it is also fair to point out that the EU countries participate in a joint economy with mutually-related import/export, trade, and taxation policies. The GDP of the EU is a little larger than the US and that comparison animated along with the the GDP of China would have left a truer impression of worldwide relative economics over time.

From the point of view of this website, GDP provides a good first-order metric useful for comparison of economies. Its shortcomings in these comparisons are that GDP does not reflect differences in taxation, or in unemployment which are important to individual and business well-being. Consequently, per-capita GDP is more a measure of economic productivity of an economy, than it is a measure of average take-home pay.

Relationship between energy consumption and GDP.

GDP1.jpg

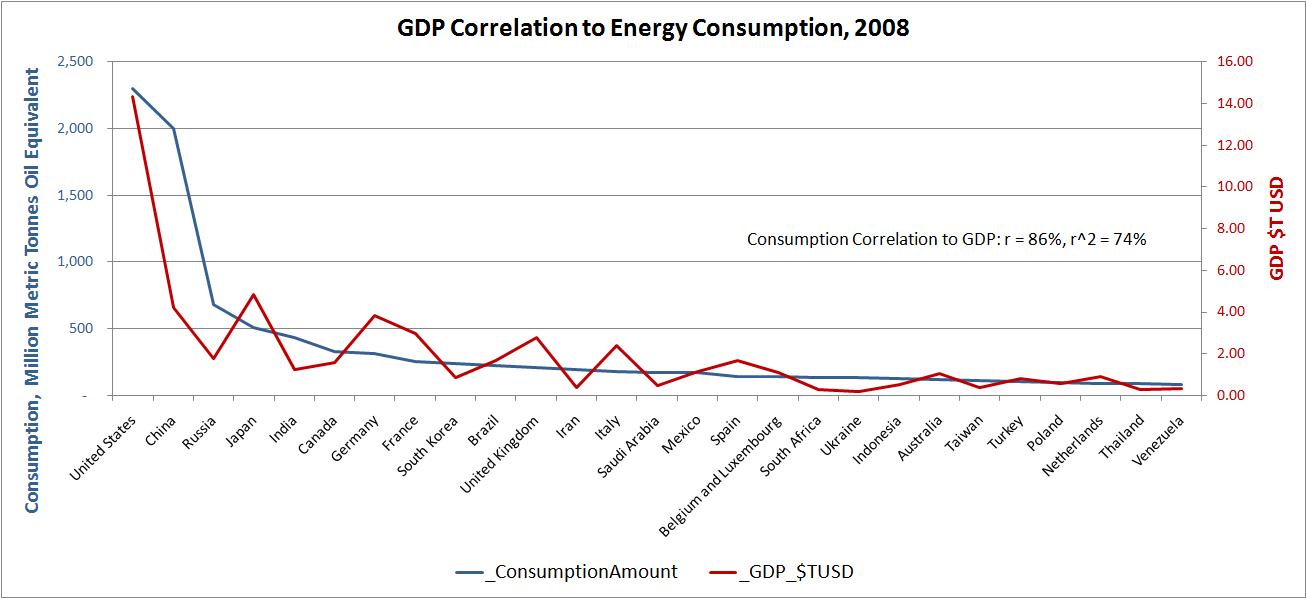
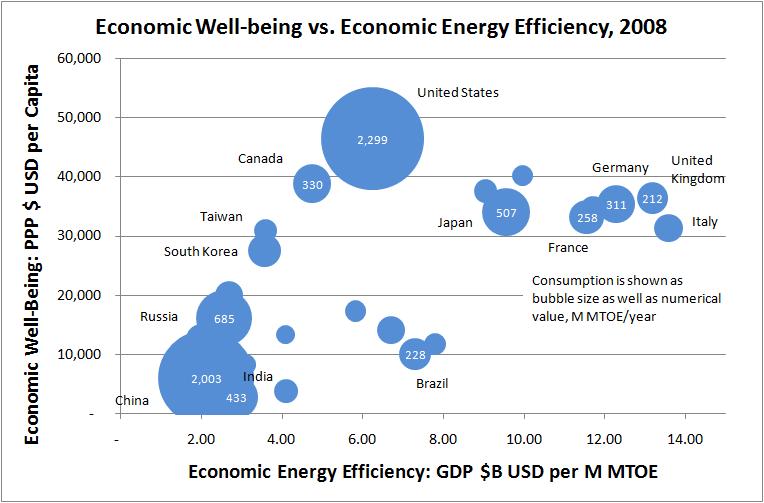
Energy consumption shows r=86%, r2=74% correlation to GDP, with significant variation by country among the largest consumers. Consumption correlates r=65%, r2=42% to population.

GDP3.jpg

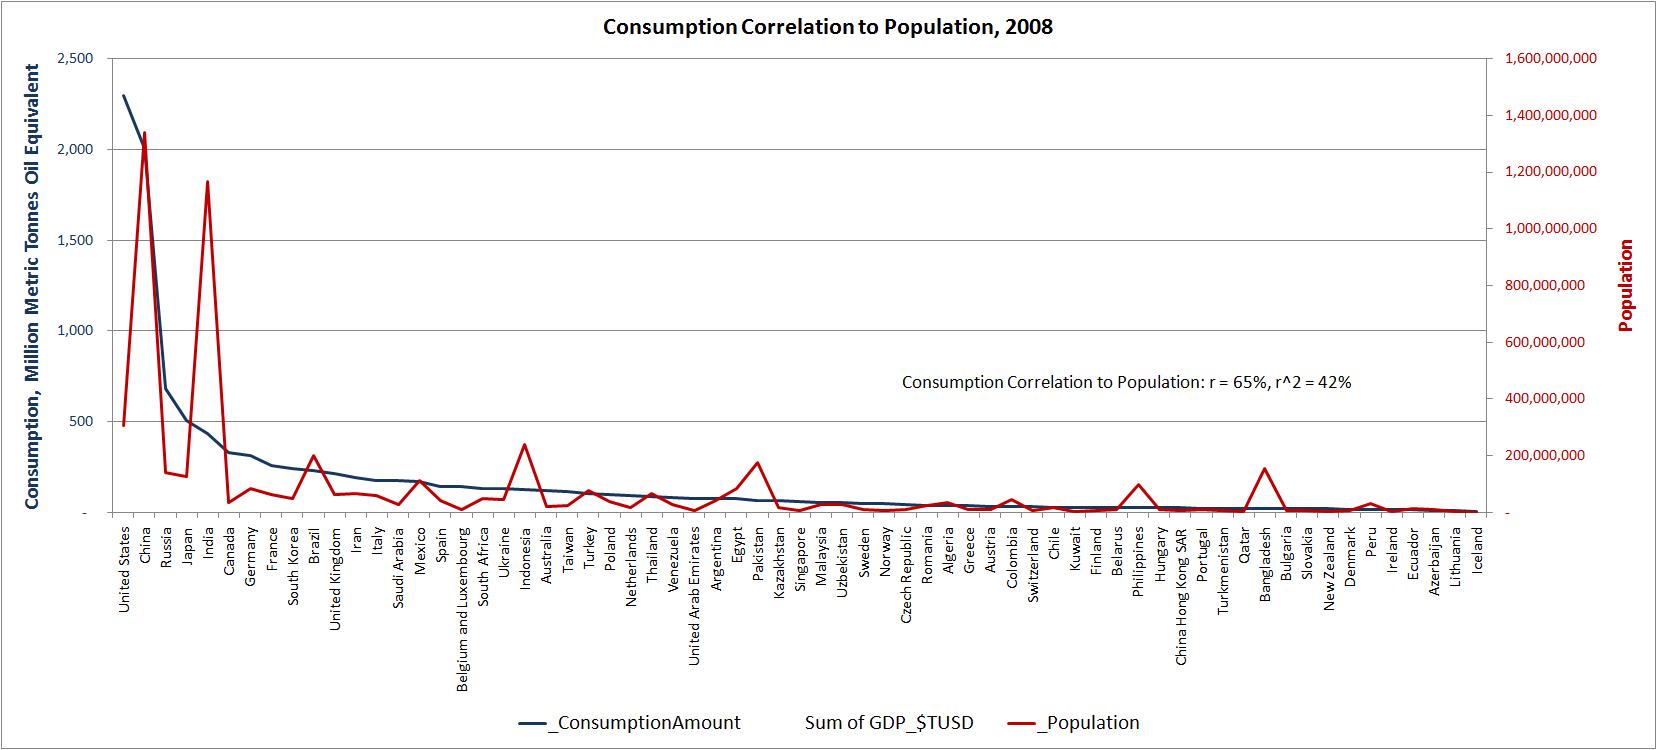
Variation may result from proportion of the economy related to subsistence farming, heavy vs. light industry, transport distances, military, and waste. Greater import of finished goods will make an economy appear more energy-efficient, and greater fabrication of goods from raw materials and energy will make an economy appear less energy-efficient.

The following charts display 2008 energy usage of the top world energy consumers, with highest consumption at left (US and China) and sorted to declining consumption to the right. Only users of more than 100M MTOE are shown. Efficiency, measured in GDP produced per energy consumption, is superimposed in red.

GDP2.jpg

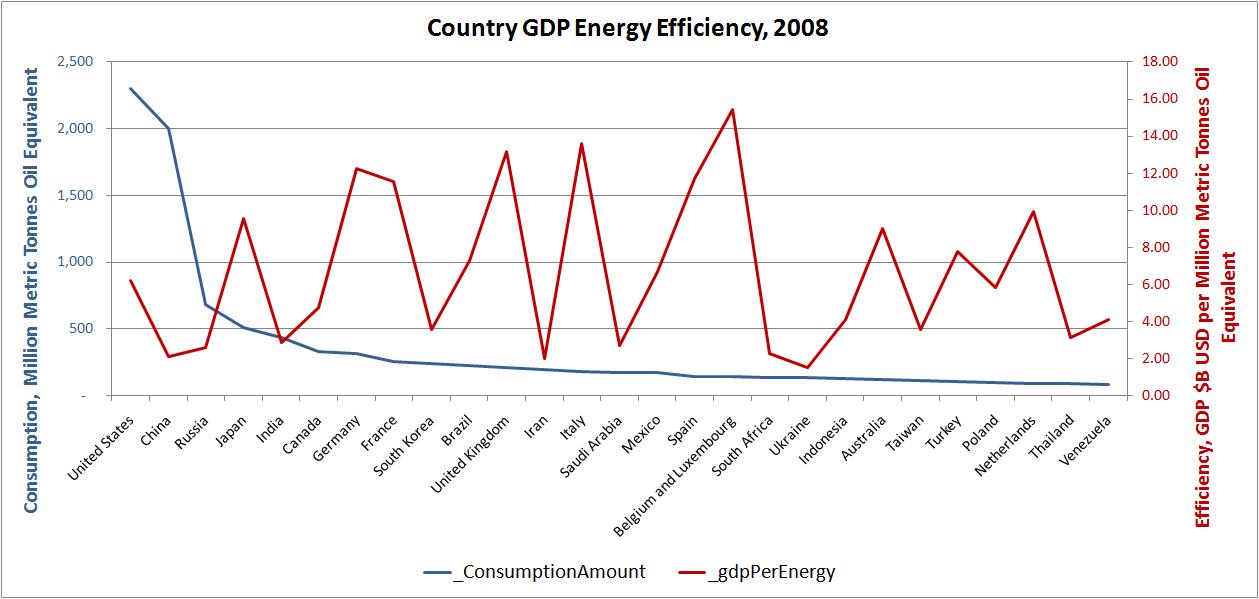
GDP is taken from the CIA World Factbook, and energy consumption is taken from the same BP data as on other pages on this site. More data is available from the EIA.

Efficiency varies among countries by as much as 500%. A clear trend is that EU countries are consistently the most energy-efficient. Efficiency of use has highest leverage among the highest users, to the left of the chart.

There's a lot of dialogue on energy consumption (actually on carbon footprint), that involves the US, China, and India. The following chart includes those regions, as well as the EU as comparison to an industrialized economy of similar size to the US.

GDPEfficiency4.jpg

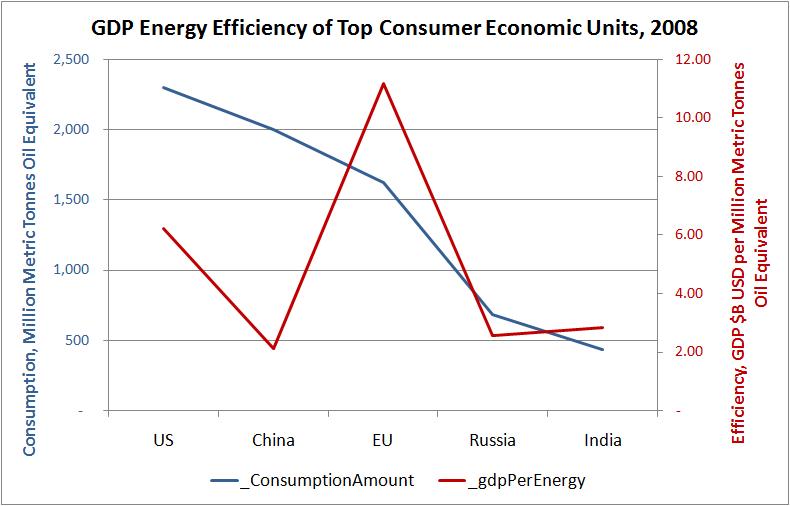
The EU efficiency trend shows up in this chart as well. The US is about half as efficient as the EU, and China is about 1/3 as efficient as the US. India's consumption is far less than the others shown.

shipping.jpg

Taxes and Incentives

Artificial economic considerations such as subsidies, tax treatment, and even profit margin will distort the picture. In the end, thermodynamics will prevail independently of these economic considerations. The effect of these distortions will really be to burn one form of energy to produce another form; if the target form is less efficient then energy is wasted and cost to the economic system is increased. Competing economic systems compete on many fronts, and this will be another one that will increase or decrease relative advantages.

mailbox.jpg

To be profitable, cash flow from an energy source must include operating costs, capital and depreciation costs, overhead; and return based on average grid cost over the time energy is provided to the grid. Normal business taxes must be included, but subsidies should not be included to determine true profitability or break-even.

Artificial considerations may well be needed to develop economies of scale, and to encourage R&D in an otherwise un-profitable market. We should however insist that break-even should be visible and moving toward us in time. 


(22 June 2010) Both fossil fuels and renewable sources receive government subsidies in one form or another. It is sometimes pointed out that the total dollar amount of subsidies to fossil sources is much larger than the total subsidies to alternative energy providers. However... this misses out the point that fossil sources provide many times more energy today than do alternative sources. The proper comparison would be subsidy dollars per MWh. Using this metric, the US EIA reports the following subsidies per KWh:

Primary Energy Source FY2007 Net Generation, Billion KWh Subsidies and Support ($USD FY2007) Subsidies and Support $/MWh
Natural Gas and Petroleum Liquids 919 $227M $0.25
Coal 1,946 $854M $0.44
Hydroelectric 258 $174M $0.67
Biomass 40 $36M $0.89
Geothermal 15 $14M $0.92
Nuclear 794 $1,267M $1.59
Wind 31 $724M $23.37
Solar 1 $174M $24.34
Refined Coal 72 $2,156M $29.81

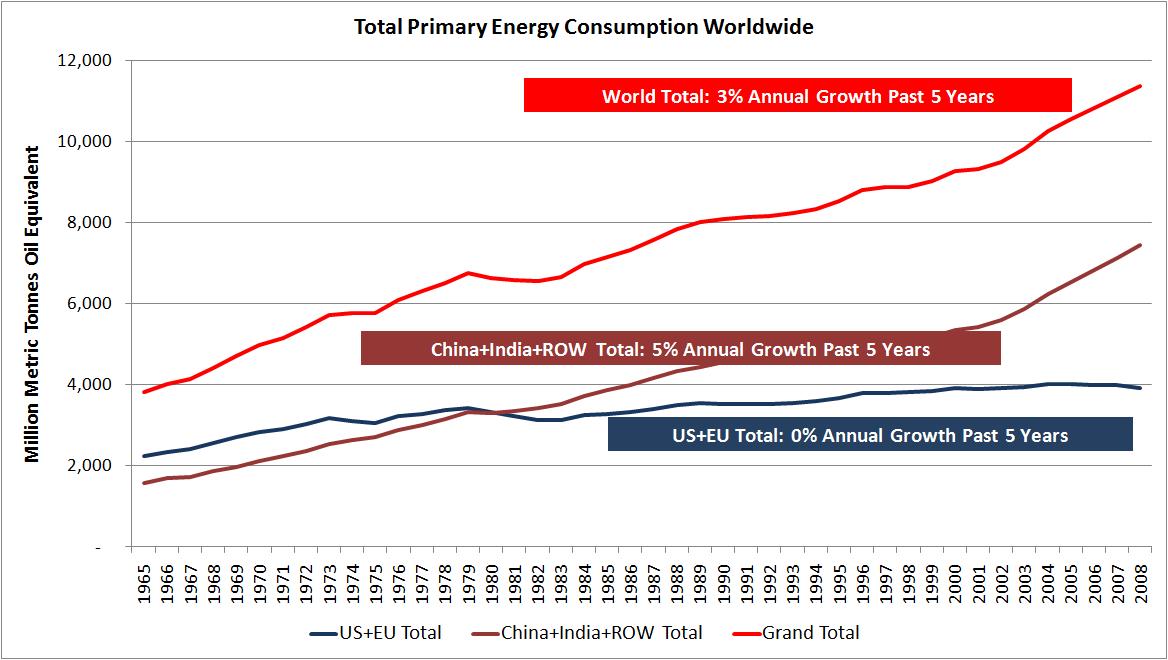
Energy Information Administration, Federal Financial Interventions and Subsidies in Energy Markets 2007, SR/CNEAF/2008-1 (Washington, DC, 2008)

Cap and Trade

Recall that China today uses nearly as much total energy as the US. Coal use is large and growing fast, whereas oil and natural gas use in China is growing at a much lesser rate. US total energy usage including coal has grown at a slow to slightly down rate over the past decade. So magnitude and growth of coal use is the dominating factor although similar arguments do apply to all sources.

ConsumptionSeq4.jpg

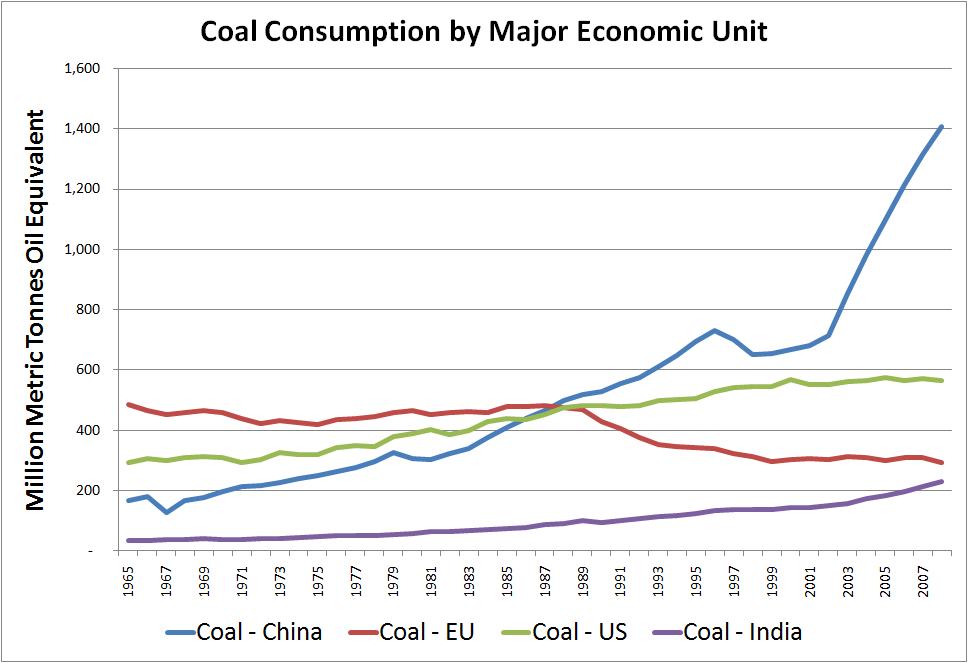
The chart illustrates that Cap and Trade implemented by the US as a measure intended to control CO2 emissions, would have very limited effect given the magnitude and growth of coal use by China.

Coal is used to generate 50% of US electricity. It's unlikely that wind and solar will be able to replace coal at this magnitude of use for years, likely over a period of a couple of decades. Cap and Trade would increase energy cost during that period, a cost absorbed by the users of electricity both directly and through derived products. Users actually drive demand.

Furthermore, wind and solar replacing coal use currently cost more than coal per BTU generated. (Tax subsidies have to be ignored for national consideration, because those costs are paid by economic activity elsewhere in the economic system and it's a zero-sum game. The gamble is that those economics will improve over time and with volume of deployment.)

So energy produced by coal use that is not replaced will cost more, and energy produced by coal use that is replaced will also cost more. The result is that the amount of the Cap and Trade tax on energy, plus any incremental cost of energy, will simply deduct from GDP. Net, the GDP of the US will be negatively affected, while CO2 accelerates anyway due to coal use in China.

It's frequently stated that Cap and Trade will increase your energy bill. That understates the effects. Energy costs pervade of all goods and services in human endeavor. So increased energy cost, for virtually all forms of energy, will penetrate all goods and services raising overall cost of living and cost of business. This includes direct and passed-through cost increases to gasoline, shipping, travel, heating, chemicals, fertilizer, food, construction... everything. It's also frequently pointed out that some energy companies themselves have endorsed Cap and Trade. Read those companies' statements carefully... they see Cap and Trade as the less onerous path than EPA regulation. Still will cause GDP loss, employment loss, and higher prices for everything.


Even a carbon tax that is ostensibly neutral (taxing a deprecated commodity, and rebating back the tax collected, to a preferred commodity) has the undesirable side effect of increasing net cost. The deprecated commodity is typically lower cost per BTU (e.g., coal) and the preferred commodity higher cost per BTU (e.g., solar PV) and the intended effect of the tax is to shift usage from the deprecated commodity toward the preferred. By this method of tax shifting, the after-rebate cost per BTU of the preferred commodity can be made less than or the same as the after-tax cost per BTU of the deprecated commodity - but that will be at higher cost than the pre-tax cost of the deprecated commodity. The average cost per BTU is increased. Taxes shift but don't create money, so this is inevitably more expensive in total.

To quantify: Using Pp to represent price per BTU of the preferred commodity; Pd as price per BTU of the deprecated commodity; and T as the tax applied to the deprecated commodity and rebated to the preferred commodity, simple algebra shows the tax rate needed for equal price per BTU between the preferred and deprecated commodity:

Pd*(1 + T) = Pp*(1 - T*(Pd/Pp)) for price/BTU equivalence;
Solving for T, required tax rate: T = (Pp- Pd)/(2*Pd)

For example if Pp = 2*Pd then T = 50% tax rate, or BTU cost of 150% of the deprecated commodity pre-tax BTU price.

Additionally, resulting demand for each commodity does not remain static, and as demand for the deprecated but lower-cost commodity diminishes, less carbon tax is collected against it so there is less tax to credit against the higher-cost commodity of which more is used. A new equilibrium point is ultimately established, at further increased total cost.

A way to avoid this is for the preferred commodity real, pre-rebate price to decline to a level near the real, pre-tax price of the deprecated commodity. This is a healthy challenge for renewable energy sources. The other way to avoid this is to use net less energy. But since energy use is fairly closely correlated with GDP, there are undoubtedly unintended effects that are difficult to predict. This result likely includes decreased GDP, resulting in long-term unemployment and economic instability - unlikely to be tolerated by the population.

Here's a discussion of the cost, both the article and the comments.

Chicago Climate Futures Exchange (CCFE). Overview of futures products. Current market quotes.

Climategate

(Nov 2009) Much about cap and trade and carbon tax is motivated by Anthropogenic Global Warming (AGW aka GW aka Climate Change). This is widely and broadly discussed and much worldwide government policy is already built around this, affecting trillions of dollars. In late 2009, however, some scandal has occurred around the scientific method used among primary researchers who have provided the foundational data and analysis. It is not the purpose of this site to get into that argument (other than to point out that economic energy availability is likely a more imminent problem and to discuss how that will play out).

Click to get your own widget

The principal pro-AGW website is RealClimate. With countering views, Climate Audit and Watts Up With That are principal sites critical to AGW. The scientific controversy goes back over a decade; disclosure of some research practices was recently disclosed (Nov 2009) and has led to the scandal. AGW has been projected from statistical analysis, complex curve fitting and trend determination from multiple data sets of fuzzy data (multiple in order to span an extended time period). The datasets have not been disclosed (disclosure is established practice in other scientific research), some are lost, and that which has been seen is questioned in terms of calibration among the data sets, and adequacy in size, timeframes, and integrity. Statistical interpretation has been the method of projection. Specific analysis programs, data filtering, trend analysis and curve fitting have not been disclosed, but what has been seen and analyzed has led to questions on the methods used. As source code for analysis programs has become available for review, conclusions have been increasingly called into question.

Review of the data and methods has been held to a closed set of climatologists justified as the only set with expertise to peer-review. However, there are many in the scientific community with expertise in scientific statistical methods who would be capable of reviewing the technical methods and data adequacy. Scientific Method does not depend on consensus; just the opposite, it relies on solid explanation of aberrant data points. Galileo would have been an outsider to accepted science in 1633. The connection between the science and politics is also called into question. It remains to be seen how the scientific discussion will play out, and how political response will develop.

(19 Aug 2010) A paper by McShane and Wyner submitted and scheduled for publication in the upcoming issue of the peer-reviewed journal Annals of Applied Statistics, analyzes the proxy data reconstruction and predictive methods used by global warming models. The article concludes that the data consists of too small a sampling of truly independent observations and is not sufficient to detect a sharp increase in temperature. Further, they state that climate scientists have under-estimated uncertainty of proxy-based data reconstructions and have been over-confident in predictive capabilities of their models. Such a paper does not go lightly into the sphere of AGW discussion, and is widely discussed in the blogosphere. Here is a starting point.

This subject, above all others, is connected to politics and in fact permeates discussion and practice on all topics on use and sourcing of energy. AGW advocates correlate to politically-progressive/statist government policies, and skeptics correlate to conservative limited-government policies. AGW policy advocates saving the world from imminent disaster through mitigation measures of extreme negative consequence to industrialized economies and populations, and demands payment for carbon reparations, social justice, economic justice, environmental justice, third-world development and the like. Advocacy discussion frequently leads to dismissiveness, ad-hominem argument, and invective. The scandal shows examples of how this has bled into the science as well. Skeptics generally identify analytical weaknesses that cast doubt on AGW advocacy predictions, and drives for open review and analysis. Open Source practices have been identified as more likely to produce a broadly credible result than government agency review. Measures identified by skeptics tend toward adaptation, rather than mitigation of an effect considered doubtful, given the enormous costs and effects of proposed mitigation methods.

At the very least, Climategate will result in re-examination of AGW/Climate Change science, gating the continued and projected huge mitigation expenditures. And since the raw data was disposed of by the primary researchers, this will be a protracted, multi-year process. During this time and thereafter, it is likely that economic necessities will overturn assumed limitations to energy use and sourcing driven previously by implemented responses to Climate Change logic.

It remains likely, as discussed elsewhere on this page, that oil supply will become increasingly contested and that oil price will inexorably increase, pressuring transportation and agriculture. Alleviation of transportation cost issues will drive back to affect other energy sources, and is likely to lead ultimately to increased demand for electricity for EVs.

A net effect of Climategate will be to more freely enable use of coal for electrical power generation. Nuclear power restrictions are not so connected to Climate Change and so remain unaffected; so use of coal to generate electricity will gain relative advantage. Coal is the cheapest source of electrical power, so this will in turn put pressure back on cost requirements for wind and solar-generated electricity, slowing broad deployment.

The position of this site is that regardless of AGW, energy supply is likely to be an increasingly important and visible issue, and the purpose of this site is to discuss how this will manifest, and reactions to it. Let's not lose the importance of this topic in the scuffle over the AGW controversy.

  • Analysis of green energy initiatives in Spain through 2008. Each green job created cost 2.2 jobs elsewhere in the economy. Only one in ten created job was in permanent operation; others were fixed-term. 31% higher public electric cost. Drove out energy-intensive industry, diverted capital to low-return from higher-return projects, created perpetual investment in high-cost infrastructure.
  • 2008: Wood-Mackenzie analysis of Carbon Trading and Emissions Reduction, with results in Europe.
  • August 2009 paper From Edison Electric on effects of Cap and Trade. Coal plants already closed with increased generation cost already resulting. Access to capital markets is constrained. Substantial financial return to government from cap and trade auctions ($120B to clean energy; $83B return to taxpayers; remaining $443B returned to government, but use not specified!). Wide range of predictions of consumer cost increases. Renewable capacity driven to substantially higher proportion, but generation costs are increased. Codes and standards on household electric equipment to mandate efficiency increase. Even if you are ideologically in favor of cap and trade, this is a good current source of information on economic effects.
  • Sept 2007: The most serious Economic Analysis of Cap and Trade that I have found. Note that it was produced before the current legislative action, and draws on numbers produced by the CBO. There are a number of additional relevant articles on the same site.
  • An argument for carbon tax. This is not the Waxman-Markey bill for cap-and-trade but seems to detail some rationale underlying the bill. Carbon tax to offset other taxes, so tax-neutral.
  • Summary analysis presented to the US Senate 8 July 2009 by Ben Lieberman of Heritage Foundation.
  • 19 March 2009: Council on Foreign Relations discussion: Economists cautious, Natural Resource experts bullish.
  • 26 June 2009: Wall Street Journal on Cap and Trade. On selling the bill in Congress, leaving out the economics.
  • 26 June 2009: Discussion in Motley Fool. Memorable quote from public comments: "Bad economics added to questionable science"?
  • 18 May 2009: Institute of Energy Research report.

Site Focus:
Quantifiable Discussion

industry_industrial.jpg

Much of the advancement of the topic of energy leaves out quantization of the arguments, or presents an incomplete or one-sided view favorable to a political or idealistic point being made. The object of these pages is to lay out quantitative perspective covering both the current energy situation, and how it may play into use of alternative energy resources. Resources are provided via links to articles that define or represent the state of each topic.

Example. Frequently, the point is made that the US uses 25% of the world's energy but contains 5% of the world population. China has stated this in arguing that Western nations should reduce emissions first. Whatever the numbers used, this argument claims that US per-capita energy use is wildly disproportionate. However, consider the following:

  • The US imports about 14M barrels of petroleum per day, and uses about 19M barrels  per day. The US population is about 300M people, and GDP is about $14T USD.
  • Made up of 27 countries, the EU imports about 14M barrels per day and uses about 19M barrels per day. EU population is about 499M, and equivalent GDP is about $16T in USD.

The numbers are not identical of course, but are certainly are far more comparable when industrial economies of similar size are considered, than the commonly-expressed comparison. Worldwide, energy use is proportional to GDP of an entity and the mix of industrial vs. agricultural components within it. This would not be too surprising since similar technologies are used worldwide.

180_coal_train.jpgA variant of this argument states that the US produces more carbon per capita than any other country. Both China and India have used this argument. The Ambassador of China suggests that developed countries should reduce GHG by 2020 to 40% below 1990 levels, while developing countries should take "appropriate" actions . However, a per-capita argument is irrelevant to climate. For global warming caused by atmospheric carbon load, the chemistry of the world does not care how many people it takes to produce the carbon load - instead it is affected by absolute load produced.

Looking at the energy-use-diagram, it is apparent that most energy used in an economic unit is not used by, or even on behalf of, the population comprising the economic unit. Rather, a small minority of energy is used by the population for its own ends, the majority being used for industrial production, for agriculture (via transportation), and as thermodynamic losses, the three of which largely support trade with external partners. So as far as energy is concerned, the population is more likely a source of labor to produce trade goods. A look at the economy of China, ironically, demonstrates the balance of power use toward industrial. Also related, and further discussed below, is that as economies develop they shift industrial production to less-developed economies to capitalize on lower costs in those economies. A look at US and EU vs. China economies demonstrates these points.

Looking at energy consumption by economic unit, it is likely that the Asia/Pacific region use of coal produces the greatest atmospheric carbon load. China by itself uses almost 3 times as much coal as does the US. (12 Jul 2010) Put another way, China annually uses fully half of global coal production. The GDP of China is about half that of the US, and is growing at 2-3x the rate of US growth. In fact, China reached top polluter status in 2006 according to the Netherlands Environmental Assessment Agency.

The position of this site is that energy policy should prioritize development and deployment of effective clean coal technology both domestically and worldwide.

  • Clean coal technology could be sold to regions heavily using coal, such as Asia/Pacific, to reduce what appears to be a majority contributor of carbon emissions.
  • Domestic use of effective clean coal would produce an energy source that would provide regional energy independence for quite some time. This could be used along with other sources: renewables as they become economic, nuclear, natural gas. Each of these requires its own resolution.

Renewable technologies would still need to be developed, coal will be depleted at an increasing rate but this strategy would buy time to develop and make those technologies more economic and to deploy them in scale.


Note that China has a population 4x the US population, uses approximately the same amount of energy, and produces about 1/3 the GDP. Energy use per GDP is therefore about 25%, and GDP per capita is less than 10%. China's stated objective is, understandably, to raise GDP. China's growth has truly been an "economic miracle", discussed in this paper from 2006, which discusses contributions to CO2. Analysis shows CCS could reduce China's CO2 emission in 2030 by 44% from the current scenario, but those emissions would still be 80% higher than 2002 China emissions.

GDPEfficiency1.jpg

The illustration above shows efficiency in use of energy to produce GDP along the horizontal axis, versus productivity measured as per capita GDP on the vertical axis. This metric compares relative international economic strength. Countries using more that 80 million MTOE annually are shown. The bubble size is proportional to annual energy usage. Greatest energy efficiency, and greatest proportional GDP creation is at the upper right corner. The EU countries as a group are well-positioned in that space. This chart shows that US energy policy could work toward increasing energy efficiency (in addition to sourcing). Other countries have varying degrees of work toward efficiency and GDP creation, to position competitively with the EU. Increasing GDP per capita, as a proxy for individual well-being, is a universal objective.

As pointed out earlier on this page, comparison of GDP per capita is not a perfect comparison because it doesn't account for differences in taxation or for unemployment. Those are also very important metrics of economic health. The GDP metric shown here is an important first-order metric but is not independent of these others in gauging economic well-being.

PPPEfficiency1.jpg

PPP is a metric compiled by the World Bank, called "Purchasing Power Parity", used to compare per-capita well-being among economies. This metric is essentially GDP, including all goods and services produced in a country, valued at United States prices and accounting for cost-of-living in each country. Not all countries formally participate in the project, so it is an approximation. Note the differences between this chart depicting well-being versus efficiency, and the preceding chart showing productivity versus efficiency. PPP data is from the CIA World Factbook.

This site's position is that the important energy metric for economic units consuming more than 100M MTOE annually, is GDP-per-energy consumption and that per-capita consumption metrics are disingenuous.

As an economic unit increases GDP, maintaining a competitive GDP-per-energy consumption will achieve parity in per-capita energy consumption by major economies in a way that benefits everyone. This metric is important if either population or energy consumption of an economic unit (country or region) are large.

SPE paper on hydrocarbon policies, along similar lines.

industry.jpg

Another example. The economies of China, the US, and the EU will grow and compete for energy sources..

  • The US GDP is $14.3T USD in 2008, growing at an average rate of about 3%.
  • The GDP of China is $4.2T USD in 2008, projected to grow at 8% for the next ten years.
  • If these rates were constant, the Chinese and US GDPs will be close in 2028, at $26T USD each, total $52T growth from $19T, about 5.2% per year combined growth rate. In this model, combined growth rate increases over time. Combined GDP would double by 2023.
  • Modeling a growth rate declining over time as a function of each economy size (probably more realistic), the GDPs do not intersect but the combined GDP doubles by 2033 with China $15.5T, US $25T, total $40.5T, about 3% combined average growth rate. In this model, combined growth rate declines over time.
  • Hence, model numbers indicate that energy source growth must achieve 3% to 5% annually worldwide to accommodate competition for resources driven by growth in GDP over the next several decades.

Total energy commodity consumption and growth rate

consumptionSeqWorld.jpg

The preceding chart shows total total consumption amount and annual growth rate of primary energy sources. ("ROW" means "Rest of the World".) The 3% annual consumption growth rate is consistent with doubled use by 2035.

Population projections by the United Nations in their World Population Prospects, The 2008 Revision, are consistent with the expectation of continued energy consumption increasing at this rate.

population-un.jpg
Summarizing relevant points,
  • The UN report provides several scenarios. Data above are from the Medium scenario. Population growth is inevitable for all scenarios, until 2050.
  • Population growth is determined as a function including current populations, age distribution, longevity, mortality, and fertility.
  • Worldwide population growth is concentrated in developing areas of the world (included in "ROW" in the chart above) and remains limited in more developed areas (including the US and EU).
  • The fertility rate is shown as decreasing by 2050 for all areas of the world, declining below replacement rate for all areas except the least-developed. For the Medium scenario, this implies that population peaks about 2050 with slow decline thereafter.
  • If the fertility rates estimated in this scenario are optimistically low, then population growth may continue. The UN report states that the need for family-planning services in developing areas of the world is pressing and urgent, to achieve the projected fertility rate.
  • The UN report states the urgency of supporting employment creation in developing countries. This implies that both GDP growth and population growth will drive projected growth in energy consumption.

Long-Term Oil Price

Of the primary sources in broad use, Coal, Nuclear, and Hydroelectric are mostly sourced domestically as is much of Natural Gas. Oil, however, is produced and consumed internationally so competition for oil will continue to be intense as these economies grow. Oil is of course key to transportation until other means such as EVs or NG hybrids can economically augment and perhaps ultimately replace it. Fixed-plant generation sources are somewhat more fungible among coal and natural gas or alternative sources including hydroelectric, nuclear, and wind and solar as they become available.

We should expect oil prices to be increasingly affected by these factors:

  • Increased global competition, driven by growth of the economies as described above.
    • Each year, each country must maintain production from existing tapped sources; replace depleted sources with new sources; and increase oil supply from existing and new sources consistent with growth of its economy.
    • Nationalized oil companies should be expected to cover national interests before making oil available to the open market.
    • Oil on the open market goes to the highest bidder, within the commodity trading structure.
    • Note that China is aggressively acquiring and developing worldwide oil leases.
  • Worldwide population growth, from 6.8 billion today, projected to 9 billion by 2050.
  • Reserves will of course be available for years to come, but the cheapest are extracted first and costs are likely to increase as more expensive reserves are tapped.

Long-Term Energy and World Economy

Hannes Kunz discusses relationships between primary energy inputs and economic output. Energy economic variation is explained as "Economies with substantial exports of low-cost goods and services that include a significant amount of manual or industrial labor use more energy per GDP$, while de-facto de-industrialized service driven economies become more "energy efficient" because they import finished goods instead of energy and raw materials." When human energy is quantified (7.2MJ/day/human) and added to primary energy, energy efficiency is found to be surprisingly consistent. Cheap energy is found to be a driver of economic growth because of its high productive leverage; and fossil fuel is significantly cheaper than energy from any other source including human labor or renewable PV or wind. Most "efficiency" gain is from replacement of human labor with fuel and machinery. However, EROI (energy return on investment) decreases as more expensive sources are used (about 20:1 2009), reversing productivity gains. Particularly affected will be transportation, and particularly agriculture. Growth over the past fifty years has been supported by energy, and capital leverage. This is particularly well exemplified by the US and also China. Increased energy cost to replace human labor affects emerging economies earlier than developed economies. As EROI decreases, trade becomes less attractive, leading to declining GDP.

Movements for Global Warming, Peak Oil, and Peak Resources each are fundamentally about limits to human society.

The economy may be described as comprising several sectors: the Primary Economy, based on products of natural processes (agriculture, energy, mining) - necessary to survival; the Secondary Economy, production of goods and services - real wealth; and the Tertiary Economy based on services, including economic abstractions of value (money, credit, derivatives) - measuring and distributing wealth. (Additional sectors may describe research, education and other intellectual activity; and societal constructs such as government, healthcare, and media. Other sector organization may differentiate among public, private and social sectors.)

Most relevant to this site is discussion of economic re-localization as the era of cheap energy ends. Historically, complex societies eventually overshoot their resource base and decline. Many decisions toward centralized economies depend on economies of scale which are themselves based on transportation. Transportation depends on available transportable energy. When transportation becomes constrained, the economic decline is characterized by centralized economic structures falling apart, resulting in sharp decline of long-distance trade with the majority of goods and services produced locally.

Energy follows first, laws of thermodynamics; secondarily, laws of economics; and effects of government policy only after these. It is limited by its own availability (and by storage, including storage in other commodities such as agricultural product). Modern economics however is based on an expandable supply of money un-connected to physical resource; and considers energy as continuously renewable, inadequately nuanced by limited resources. But as resources decline, production of energy becomes less profitable and investment migrates away from the primary and secondary economies, as is seen in current world economies.


Trade, Transportation, and the Chinese Finger Trap, by Nate Hagens, originally published in 2005, is an early analysis of the effect on trade of increasing energy costs.

Adam Smith in Wealth of Nations, and the Ricardian model of trade show that both parties to a trade benefit from the trade itself. Each trades goods they produce most cheaply, for goods of higher value to them from their trading partner, which results in total wealth increase to both parties. The article then discusses the effects as the cost of transportation exceeds the benefits of the trade.

Discussion includes illustration of Comparative Advantage, including specialization of production by partners and resulting reduction of free trade as interdependence results. Capital mobility ultimately results in globalization of trade, with significant interdependence. For example, trade accounts for about 30% of US GDP. Oil itself, as of 2005, makes up about 10% of the dollar value of imports to the US. Services account for about 55% of US GDP (so goods are about 45%), and this is partly an effect of reduction of energy intensity in the US economy.

The Gravity model of trade presents a more empirical/less theoretical model of trade and incorporates relationships among trading partners' size, distance, and transportation needed. The model asserts that trade is inversely correlated with distance; higher transportation costs would strengthen this relationship.

It seems both intuitively and quantitatively correct that transport efficiency increases from air to track to rail to water. For short distances, bicycles provide the most energy-efficient means of transport. Hagens discusses a thought-experiment on understanding the localized content of an item; it may be produced locally but contain underlying components of various complexity that are produced by non-local trading partner. An observation of common items on store shelves shows the enormous degree to which non-local trade is embedded in everyday goods.

Finally, Hagens poses relationships between Maslow's hierarchy of needs, to a hierarchy of energy use from low-intensity to high-intensity transport means. His was an early conclusion that increased localization of economies will be driven by increased energy costs.

The Projections page on this website makes some predictions on how this may affect many aspects of energy in commercial and societal use.

Energy Economic Metrics

All of the discussions so far on these pages have been about comparative economics of use of energy. Managing the Peak Fossil Fuel Transition: EROI and EIRR proposes economics of the energy itself. Author Tom Konrad, Ph.D. first quantifies energy return on investment of energy sources and energy storage media. In general agreement with arguments put forth earlier on this page, he shows that EROI will decrease over time as higher-cost reserves of fossil fuels are tapped, and as lower-EROI renewable sources are deployed. (refer also to figures at Sigma Xi.)

It always costs energy to create energy. An important characteristic of cash flow for renewable energy sources (which in this analysis includes nuclear energy) is that a large majority of the investment is up-front (turbines, panels) and that the return is relatively low, over a long period of time, with no fuel cost. While transition to these lower-EROI sources is in progress, we would want to maintain economic activity in the non-energy economy. These together imply that it will be important to maintain high-EROI sources in order to have the energy available to transition sources while running the economy.

Investments made in dollars are analyzed using IRR (internal rate of return) and NPV (net present value). ROI (return on investment) is also used but is simplistic in that it doesn't take into account timing of cash flow and the time-value of money. Since the timing of availability of energy will be an important consideration, Dr. Konrad introduces EIRR (energy internal rate of return), in a manner entirely analogous to dollar investment analysis, to incorporate timing into the analysis. In the end, highest EIRR sources are the most valuable during the life of their production plants.

The conclusion of the initial analysis is that nuclear, PV and hydroelectric are least capable of providing surplus energy to fund transition "hump" energy investment; and that oil, gas and coal will need to be maintained for the transition. Additionally, wind and wood chip co-firing (an adaptation of coal plants to use up to 10% wood chips) are found to have comparable EIRR to the fossil fuels. Natural gas is also shown to have comparable EIRR, subject to concerns about reality of reserves discussed on this site's primary sources page.

Finally, Dr. Konrad proposes that efficiencies of energy use would have much higher EIRR than even the fossil fuels, although this is not presently quantified.

(Note that there is much discussion by blog commenters on the quantifications used to arrive at these conclusions. Nevertheless, with further development, the EIRR metric proposed seems quite useful to suggesting viable energy strategies.)

There is much discussion in blog entries on the merits and metrics proposed in the article. Commenters add significant nuance to the original article; some don't agree at all, others quantify source metrics differently, and others point out that increasing extraction costs haven't yet been figured properly into the results shown. Much more work on developing the EIRR concept is implied. Development of the proposed EIRR metric, perhaps along with ENPV, are a significant contribution to analysis of energy source strategy going into the future considerations discussed in the article and on this site.

(Dec 2010) Alternative energy sources generally require significant up-front capital investment, with on-going investment in maintenance but little or no continuing investment in fuel (sunshine and wind are free). Primary energy sources also require up-front capital investment, and ongoing investment in maintenance plus ongoing expense for fuel. However, in a time-value analysis the ongoing cost of fuel tends toward zero in out-years because that cost is numerically discounted by the NPV or other time-value analysis. An article at The Oil Drum discusses time-value analysis and compares results for primary and alternative energy sources.

Links