

Renewable Energy SourcesArticle by Vinod Khosla on "What Really Matters in Thin Film Solar Startups?", from GreentechSolar. A report "The United States PV Market: Project Economics, Policy, Demand and Strategy Through 2013" from GTM Research reports the following findings:
A report by the US National Renewable Energy Laboratory echoes this market analysis. (22 June 2010) Both fossil fuels and renewable sources receive government subsidies in one form or another. It is sometimes pointed out that the total dollar amount of subsidies to fossil sources is much larger than the total subsidies to alternative energy providers. However... this misses out the point that fossil sources provide many times more energy today than do alternative sources. The proper comparison would be subsidy dollars per MWh. Popular wisdom would be that as oil price increases, alternative sources would see an advantage but current data show otherwise. For investors, correlation between oil return vs. alternative energy has been weak to non-existent. Here is an analysis on Seeking Alpha, a most interesting financial blog. Renewables generate electricity, most of which is currently generated using coal, very little oil so there is little correlation. Electric Vehicles are not yet in common use so there is not substitution between transportation cost of oil vs. electricity either. Low correlation between oil and natural gas vs. the renewable-energy ETFs studied shows that widespread cost-driven substitution is not yet occurring at current subsidy levels. From TimesOnline (UK) Jan 2010: Wind and solar power provide power that varies with the amount of wind or sun available over a short period of time. This means that power utilities must provide continuous base power that can be augmented by the variable sources. European installations including Spain, Germany, and the UK have experience integrating variable sources into a base grid, and have experienced instances of grid instability and surges. These countries have phased out investment in nuclear generation. In Germany, renewable sources account for 9.3% of domestic energy consumption. However, utility companies keep conventional power generation online to deal with variability of wind-generated power. In the UK, this has been accomplished by expansion of use of natural gas but this in turn has made the UK more susceptible to Russia and Algeria, as North Sea gas declines. Consequently, nuclear power is likely to resume investment in nuclear power generation, at least to bridge working out the wrinkles of integrating variable renewable sources. (13 Apr 2010) A 2009 report by Lawrence Berkeley National Laboratory tracks trends in Installed Cost of Photovoltaics.
(27 Apr 2010) 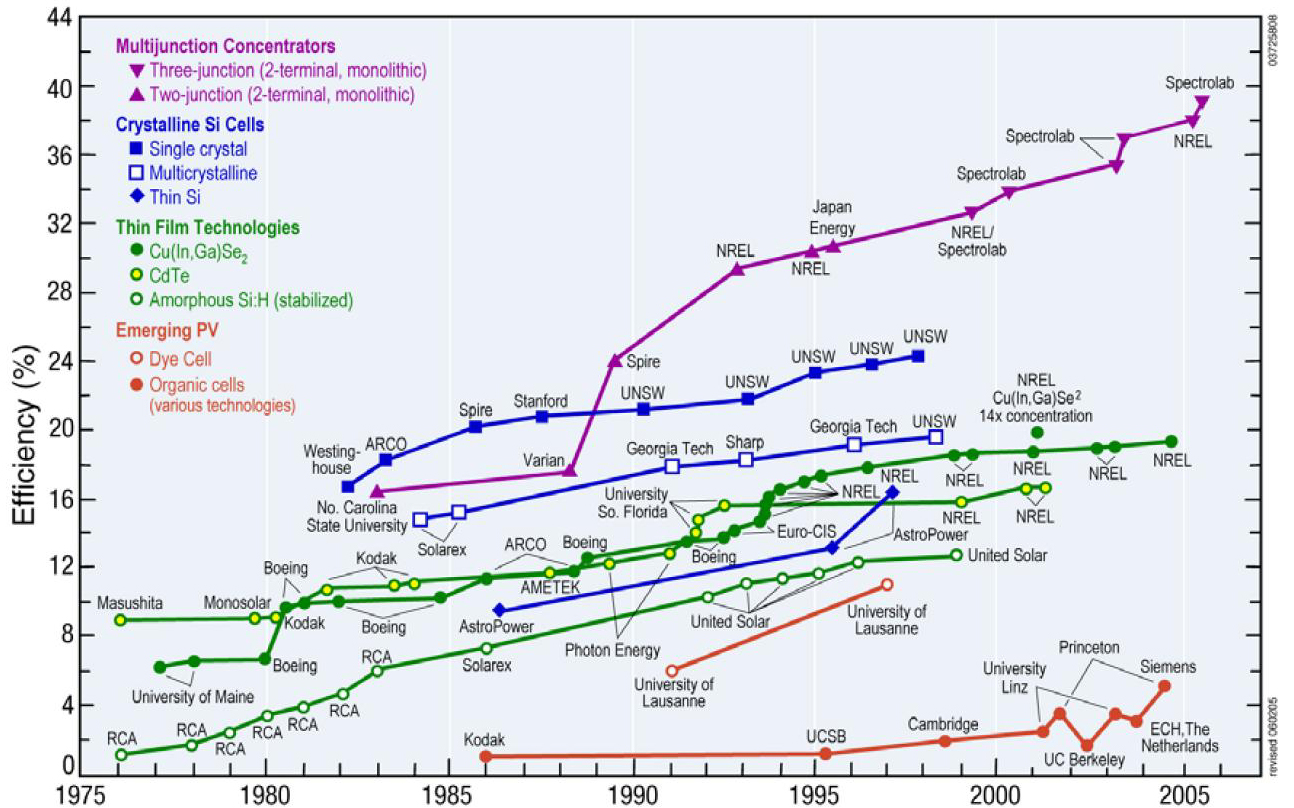
|
|
Solar - CommercialEnvironmental benefits of Solar are well recognized, but have been inhibited due to relative costs. Renewable Energy Test Center in Fremont, California presents status as of September 2009, and progress toward grid parity. Grid parity means that total cost of generated power is equal to the cost of power delivered from all sources by the public grid. Proximity to parity varies from country to country based on latitude, geography and other factors. Also, various governments provide varying degrees of incentives (although, remember assertions on other pages on this site that those incentives are paid for by activity elsewhere in the economy, that use energy generated primarily from other sources with less-advantageous environmental properties.) Current US federal subsidies for commercial solar installations include: 50% depreciation bonus on capital installed by 12/31/09; 30% investment tax credit through 12/31/16; treasury grant in lieu of investment tax credit, through 12/31/10. These subsidies keep the solar industry solvent while technology advances to achieve grid parity. Additionally, localities set feed-in tariffs (FiT) by which electric utilities are mandated to buy power from small localized sources. In Europe, this was set at premium rates, perhaps as much as double. Examples include Germany, Greece, Italy, Turkey; and in North America, Ontario Canada and Gainesville Florida. In late 2009 California implemented a FiT, equal to the Market Price Referent for power obtained via a long-term power contract from a combined-cycle turbine facility. Spain implemented a feed-in tariff in 2008 but has since rolled it back. Various reports linked in this article indicate that high FIT rates are an extremely expensive way to cut down emissions and have not contributed substantially to increased deployment of solar panels nor to consequent volume-driven desired decrease in panel cost. FIT has nevertheless remained controversial among advocates, but early in 2010 the German environment minister began cutback of the rates. On the Transmission page on this site, notice that PV delivery cost is significantly affected by the need for DC-AC inversion so that PV-generated power can be distributed on the AC grid. Alternatively, if a DC grid were available to provide DC service, voltage step-up would be needed in order to lower current and consequent line loss. Compared to transmission equipment needed for AC, equipment for DC inversion and step-up/down is relatively expensive, inefficient, and short-lived. Competing AC generation sources and delivery systems do not need inversion, and step-up is accomplished by high-efficiency transformers. SolFocus is a provider of Concentrator Photovoltaic steerable solar panels. They provide a CPV primer on their site that provides a nice survey of solar technologies, but no financial analysis. CPV is 1-2 orders of magnitude more efficient than PV systems, and are relatively cheap to manufacture. They have a relatively narrow acceptance angle, so may need steering; and are susceptible to dust and clouds.
Solar - Home2009: Discussion of Net-Metered PV Systems. New York State Energy Research and Development Authority (NYSERDA). On this site is a link to a Clean Power Estimator. The Vermont Energy Investment Corporation has a links describing dollar incentives for solar electricity and hot water. The challenge for Photovoltaic systems is to become self-sustainable both in operation and in manufacture. Running a default example of the New York estimator, net system cost for a typical residence in Ithaca NY zip 14850 using 3KW-ac is $8,096 and breaks even at 15.7 years. Loan rate is 8% for 30 years, yielding internal rate of return of 10%. Due to day/night and weather, the system supplies 51% of demand. The system does not use battery storage, but sells about 30% of production back to the utility. Deeper examination of the numbers shows that the system cost is $26,100 with incentive offset of $19,094 and that costs do not include Operation and Maintenance. The net is that without offsets, the system isn't self-sustaining, rather it is a net energy sink. The incentive offset is funded by a net expenditure of energy in the overall economy (to develop, manufacture, market, ship and service) so is mostly funded by use of non-renewable fossil fuels. Enough of these systems to offset any visible amount of 19M barrels of imported oil per day will need to include O&M cost, insurance and the like which makes the gap to sustainability even wider. Newer CIGS cells (Copper-Indium-Gallium-Selenide) have more promise of self-sufficiency. CIGS cells achieve 19.9% compared to 24% achieved by crystalline silicon cells, but CIGS cells are much cheaper. The linked article in Wikipedia lists numerous companies working on CIGS. Wind
A financial analysis shows fully cost-burdened wind energy from GE industrial turbines is competitive with coal. Digging in a little shows 100% first year depreciation reduction, 30% declining balance accelerated depreciation, $.01/kWh production incentive (~17% of price), and un-specified federal subsidies and emission credits. So it's still higher than coal by those amounts on an ongoing basis but fairly close as of 2009. Note that page 26 of the presentation linked above gives some comparison of commercially-delivered cost per kWH of various energy sources. Again, be conscious of tax credits used when comparing energy costs; tax credits distort the apparent picture, and are derived by expenditure of some other form of energy elsewhere in the system. The American Wind Energy Association also provides cost information, and is a broader source of information on wind energy as well. Pickens Plan: Wind, with Natural Gas as a transitional bridge. A survey of wind turbine suppliers by the editors of weSRCH shows that Vestas is the market-share leader, but is losing share at -5% per year having gone from 42% share in 2001 to 19% in 2008. It is Chinese companies that are picking up share, gaining +3.6% over 2007-2008 compared to -2.1% loss by US companies and -2.4% loss by EU companies. Henrik Lund, Large-scale integration of wind power into different energy systems, Energy, Volume 30, Issue 13, October 2005, Pages 2402-2412, ISSN 0360-5442, DOI: 10.1016/j.energy.2004.11.001 Fuel CellFuel cell technology directly creates electricity using a fuel in a continuous chemical reaction. A fuel cell is not a renewable energy source, but could be considered an alternative energy source by some. There are several fuel cell technologies, varying among operation at high temperature using natural gas or methane, or at low temperature using hydrogen. The vast majority of electricity generators today are driven by combined-cycle turbines, powered by steam created by burning coal or natural gas, or from nuclear heat. Turbines are heat engines, so their efficiency is determined by thermodynamics. Combined-cycle turbines use the Rankine cycle, for which theoretical maximum thermodynamic efficiency is about 60%. Common implementations today operate near this limit. Fuel cells thermodynamic efficiency limits are theoretically much higher than for heat engines based on Rankine or Carnot cycles. The great advantage of fuel cells is that they can be theoretically 80-90% efficient, about 50% more efficient than combined-cycle turbine electricity generation using the same fuel. (2 Aug 2010: However, a DC-AC inverter subtracts about 15% efficiency to net 65-75%, for a theoretical net efficiency gain of 5-15% over NG IPCC.) Heat generated by a fuel cell can be captured in a combined cycle, and used to further increase efficiency. Efficiency of this technology, compared to combined-cycle generation, leads to either more energy generated per fuel input so lower-cost electricity; or less fuel used per watt generated so lower emissions; or a combination of lowered cost and lowered emissions; hence the claims for low-emission cheap electricity from fuel cell technology. Fuel cell technology issues include cost and reliability. Although fuel cells operate with high efficiency, equipment cost has been high enough that it has consistently offset benefits of fuel cost reduction due to efficiency. Additionally, temperature cycling can cause breakage of the equipment, further increasing cost. Fuel cells to date have been unable to compete economically with combined-cycle generation. Bloom Energy (symbol tbd) recently announced their Energy Server suitable for use in building or campus electricity generation. These Energy Servers each generate 100kW, cost $800K - $900K, and operate using natural gas at about 800°C. The reaction is CH4 + 2O2 → CO2 + 2H20 + e- + Heat. Bloom's Energy Servers use thousands of solid oxide cells, using low-cost materials and limiting differential expansion of the material, improving reliability. Using the resulting distributed generation architecture, electricity is generated locally, although gas must of course be supplied locally to fuel operation. Broad deployment would distribute electricity generation, decreasing grid generation and transport, but would require expansion of local distribution of natural gas.
|
|
|
A New Optimal Path?
|
|
Companies - Solar
Companies - Wind
|

