
Primary Energy Sources: Oil, Natural Gas, Coal, Nuclear, and HydroelectricThese energy sources have properties that make them dominant today. First, these have the highest energy density of all known sources. Article on energy from fossil fuels. Renewable energy sources, as of 2009, are lower energy density and the key problem to be solved in order for them to power the economy, is to eliminate the need to use high-efficiency energy to produce means to produce lower-efficiency energy, in effect to avoid a net energy sink. The discussion of Energy Return on Investment, EROEI, on this site provides perspective. Second, fossil sources provide energy storage which in turn provides for on-demand power and also mobility of use. Other storage means have been explored but chemical storage is currently the most viable. To be competitive, a second key challenge for renewable energy sources is to provide energy storage with the net energy density and efficiency of the full storage system similar to that of fossil energy systems. For example, batteries store energy efficiently but inverters, needed to put energy in and/or take it out, are much less so. Batteries also have been challenged in weight and space. Competitive efficiency needs to be achieved for energy from renewable sources used in both fixed-plant and mobile applications. |
|
Energy Consumption - Sources
How fast can alternative sources be put online, and create energy independence? It's a huge undertaking. Let's put some scale on the problem.
BP (BP)
publishes
an annual report on energy production and utilization statistics, that puts the worldwide energy situation in perspective. (Links to report and spreadsheet.). Links have been updated to the report published June 2010 covering 2009, and for the first time including alternative energy sources. World energy consumption 2008 by geographic region. Asia-Pacific, Europe, and North America dominate. "Europe and Eurasia" includes the EU and Russia among others. "Asia Pacific" includes China, India, Japan, and Korea among others. Units are million metric tonne oil equivalent (M MTOE). 
World energy consumption of energy 2008 by source. Units are million metric tonne oil equivalent (M MTOE). 
Geographic region energy consumption 2008, by source. Note heavy coal use in Asia Pacific, concentrated in China. China reached top polluter status in 2006 according to the Netherlands Environmental Assessment Agency. China's GDP is currently about 30% of US GDP, with sustained growth projected at 8%. Units are million metric tonne oil equivalent (M MTOE). 
Breakdown of US energy consumption 2008. Oil consumption translates to 19M barrels per day. Units are million metric tonne oil equivalent (M MTOE).  Comparison of economic unit energy consumption 2008 by source. Europe trades increased nuclear for less coal use. This chart covers most usage in the EU, and excludes Russia which is included in the Europe and Eurasia data in charts above.  The US and EU have roughly comparable GDP, and energy use breakdown is fairly similar as well. Production2008 energy source production. Consistent with consumption, in Asia-Pacific coal dominates particularly. China produces about 70% of Asia-Pacific coal.  Production of oil over time shows peaking of US oil production in the early 70's followed by slow falloff. In Europe and Eurasia, Russia produces 57%, followed by Norway (14%) and UK (9%) from the North Sea, and Kazakhstan (8%). Africa is an increasingly important supplier with Nigeria producing 21%, Angola 19%, Libya 18%, and Algeria 17%. In the Middle East, Saudi Arabia produces 41%, followed by Iran (17%), United Arab Emirates (11%), Kuwait (11%), and Iraq (9%).  The spike in Middle East oil production in the mid-1970's to mid-1980's shows the effect of major world events that sound eerily similar to 2009. Prior to 1971, the US dollar was pegged to gold, and world currencies were pegged to the US dollar. By 1971, US domestic spending and costs of the Vietnam war caused the US to print dollars, resulting in inflation and foreign demands on payment in gold. In the 1971 "Nixon Shock", the US withdrew from the Bretton Woods system, taking the US Dollar off the gold standard, floating the US dollar and world currencies pegged to it. The resulting fluctuation and re-stabilization of currencies led to increasing pressure on worldwide inflation. Oil was, and still is, priced in US dollars so real income to oil producers dropped. This, and declining demand for oil, led to the "Oil Glut" of the 1980's. Over-production culminated in a 46% drop in oil price by 1986, and to $15 per barrel in the 1990's. In 1979 and 1981, executive orders by US Presidents Carter and Reagan removed price controls from the oil market price, reduced the US windfall profits tax in 1981 and eliminated the tax in 1988. In the period 1980 to 1986, OPEC decreased oil production by nearly 50% to maintain oil price. The combined effect of these actions ended the 1980's "Glut". A downward spike shows the Oil Embargo of 1973, imposed on the US and Western European countries by the Organization of Arab Petroleum Exporting Countries (a subset of OPEC) in response to emergency oil re-supply of Israel during the 1973 Yom Kippur war. Some details on pricing and delivery mechanics, announced by NYMEX operator CME: As of January 2010, Saudi Arabia's national oil company Aramco, will link prices for oil delivery to the US, to the Argus Sour Crude Index (ASCI), as will Kuwait. Saudi Aramco will publish a monthly price differential to a monthly average published by Argus. US sour crude continues to be indexed from West Texas Intermediate (WTI, futures). (22 June 2010) The website EnergyindustryPhotos.com provides an instructive overview of how oil and gas wells are drilled, including descriptions of many of the associated jobs. From New Orleans City Business, two-thirds of global oil supply now is heavy sour crude. By shifting pricing away from WTI Aramco avoids market sensitivities to inventory at Cushing, Oklahoma, the delivery point for NYMEX WTI contract oil. WTI is light sweet crude, whereas Saudi Aramco delivers mostly heavy sour crude. The move also anticipates growing importance of Gulf of Mexico (GOM) production from deepwater wells as a driver of price discovery. The Louisiana Offshore Oil Port (LOOP) off Port Fourchon, Louisana, is the top US oil entry point, receiving a quarter of US imports. Usage EfficiencyA report by McKinsey analyzes energy usage efficiency opportunities and barriers at the load. Like many topics in energy, potential is huge, costs are large, and the barriers are very tough.
Supply: Proved ReservesProved Reserves at 2008 year-end. Middle-east dominates oil reserves. US, Russia, and China coal reserves dominate reserves by a large margin. 
Proved reserves have 90% probability of economic recovery with current knowledge. Unproved probable reserves have 50% probability, and unproved possible have less than 50% probability, of economic recovery. Unproved reserves, and economic recovery prospects, are at least partially responsible for un-developed leases. Unproved reserves are estimated in the US at 120 B barrels and in the world at 1.2 T barrels. Oil is not conveniently held in nice lakes underground. Rather, it is contained in rock formations such as shale; and formation porosity, permeability, fractures, depth and pressure greatly influence cost of recoverability of oil even if there is a large expected volume of technically recoverable "oil in place". As an example of this, the Bakken Formation in North Dakota and Montana is producing a great amount of onshore oil, and has been reported to contain reserves of tens or hundreds of billions of barrels of oil. This sounds like a windfall that would very positively affect availability of oil to the US. As of 2008, however, recovery is expected to be in the area of 5% due to low porosity and permeability. The link provided above references analysis of possible production based on a referenced EIA report on reserves in the area. The analysis illustrates many facets of recovery showing differences between "technically recoverable" (EIA) and "economically recoverable". The commentary provides further insight. The net is that reserve reports are estimates of technically recoverable oil but not necessarily economically recoverable oil and therefore cannot be taken at face value. Economic recoverability analysis will vary over time based on technology and acceptable price. Discussion about the January 2010 Davy Jones shallow-water gas discovery by McMoRan just offshore in the Gulf of Mexico, drilled in 20 feet of water. The discovery is very deep, 28,000 feet; pressure is as high as 25,000 psi, "by far the highest pressures known in Gulf of Mexico wells" and almost 10x rocket engine chamber pressure required for spacecraft liftoff. Temperature is expected to be considerably greater than 400° Fahrenheit. The discovery may contain 2 Tcf of gas. This is a large discovery, but is about one month of US consumption during peak winter months. Shale is the great hope for abundant natural gas. However, analysis by Arthur E. Berman examines Barnett, Fayetteville, and Haynesville shale, with findings similar to the Bakken analysis just above. Wells are experiencing faster decline than expected, resulting in shorter well life. Commercially-recoverable reserves are probably over-stated. In late 2009, marginal recovery rate is $7-8/MCF, which makes this gas marginally profitable at 2009 retail natural gas prices. Countering possible reserve over-estimation as above, there is still a large amount of oil in Iraq, an economic supply for perhaps a decade although also production is probably subject to ongoing Middle East hostilities. Accounting rules and project financing also affect reserve estimates. Statistical methods may be used to facilitate fund raising, as this linked article describes. The article will not give you confidence in reserve estimates. It is important to note as well the declining rate of new oil discovery, and the decline of infrastructure for exploration. This article from The Oil Drum asserts that liquid oil reserves (i.e., excluding oil sands) are overstated by approximately 30%. Much of the world liquid oil reserves are in the Middle East, and these are not audited. OPEC reserves were stated upwards in the 1980s without new oil finds, in making their cases for production allocations. Since then, stated reserves have not been reduced even though substantial oil has been extracted from these fields. Higher prices would not increase liquid reserves, but may support recovery from oil sands, a substantial reserve but one that needs to be melted for recovery and therefore supports a substantially lower EROEI than conventional oil. (25 May 2010) Increasingly, US domestic oil production will be dependent on deepwater drilling in the Gulf of Mexico as projected in a report entitled Gulf of Mexico Oil and Gas Production Forecast: 2009-2018, from the US Department of the Interior Minerals Management Service. This is particularly significant in light of the drilling and environmental risks highlighted by the Deepwater Horizon disaster; balanced against increased reliance on foreign oil imports to the US. Toe to Heel Air Injection (THAI) is a technology for recovery of heavy oils and bitumen from oil sand. The process was originally patented in 2007 by Petrobank Energy (PBE.BE). Air is injected to maintain high-temperature underground burn, to reduce viscosity and to drive about 90% of the oil to a production well. Energy efficiency is anticipated to be in excess of 80%. The technology could add a substantial amount of oil to economically-recoverable reserves. Since it's controversial it deserves mention that the mean estimate of prospective resources (not yet proved) at Arctic National Wildlife Refuge (ANWR) is 10.4B Barrels, or 1,418 Million metric tonnes, a substantial fraction compared with US proved oil reserves of 3,700 million metric tonnes. An important conclusion to take away from the discussions on these pages about reserves, peak oil and economics is this: We're not running out of oil in an absolute geological sense. What we're running out of is oil that we can afford to burn. This is already happening. (paraphrased from Jeff Rubin). The Importance of Natural Gas
Natural gas is already a significant component of primary energy supply. Here is a paper discussing use of shale gas as an alternative fuel. Since there is much infrastructure already in place for natural gas, the argument is made convincingly that this could achieve supply availability, greater independence and security much sooner than renewable sources (in particular, solar and wind). It is not exclusive of those sources, but available much sooner while those develop, and approaches many of the objectives of use of renewable sources. This is consistent with the Pickens Plan. The point of view of this site is that US national energy policy should address and advance CNG vehicles and supporting infrastructure as part of a comprehensive plan. Coal TechnologiesAs the statistics on this page demonstrate, coal is widely used around the world and provides the largest proved energy reserves on the planet. In the US, 92% of coal consumed generates half of the electric power used. China uses 3x more coal than the US. Using current/conventional processes, Coal produces the greatest amount of emissions among primary energy sources, about 1 ton of CO2 per MWh, about double that for natural gas using a CCGT process. Coal-Direct Chemical Looping (2013) Recent work in a technology called Coal-Direct Chemical Looping (CDCL) has been published by Dr. Liang-Shih Fan and his research group at Ohio State University. Dr. Fan is Professor of Chemical and Bio-molecular engineering, and Director of the Clean Coal Research Laboratory at Ohio State. Conventional coal power technologies are about 64% efficient with a Combined Cycle process, and may be reduced as much as 40% more by carbon capture. Professor Fan's work on CDCL has demonstrated higher efficiency with concurrent CO2 capture of nearly 100%. A CDCL process may take several configurations. A typical sequence includes three elements:
The reducing process is slow and is limited by thermodynamic equilibrium. Its performance is key to success of the CDCL process. Ohio State demonstrated the process, operating a bench-scale 25Kw (thermal) CDCL unit for 203 hours. Reaction modeling and process simulation were also performed on an ASPEN Plus process simulation platform. The bench-scale demonstration showed overall process efficiency of 75%, converting 90-95% of coal char to CO2+H2O with 100% CO2 capture. This compares with conventional process efficiency of 58%, and 90% CO2 capture. The US Department of Energy (DoE) as well have worked on CDCL at their NETL facility, with a mid-size process demonstration in current operation. Work has been done to determine the economics of the process. Findings include determining that the process is competitive with PV Solar, more expensive than directly burning coal. The CO2 must be disposed of, reacting to form carbonates or pumping below ground. DOE have invested in development of the technology. A 250KW(th) pilot plant is under construction at the US DoE Department of Energy, set to begin operation in 2013. Watch development of CDCL, this is promising technology both for clean energy generation, and energy independence. Conventional Coal Technologies Coal technologies include subcritical pulverized coal (SubCPC, lowest temperature and pressure), about 37% efficient; supercritical pulverized coal, about 40% efficient; and ultra-supercritical coal, about 42-45% efficient. Integrated Gasification Combined Cycle (IGCC) is a process that powders and partially combusts coal to syngas, then cleans it of mercury and sulfur. The syngas is fired to drive a turbine to generate electricity and its exhaust heat may also be used in a combined cycle to generate power. Carbon Capture (CCS) equipment may also be installed to scrub output gases. This degrades output efficiency and requires substantial water such that it is less cost effective than natural gas combined cycle gas turbine (CCGT) plants which are about 50% efficient. CO2 sequestered from flue-gases can be stored in depleted oil or gas wells. Pressurized CO2 can be used for Enhanced Oil Recovery, currently in pilot projects. Questions for CCS include demonstration of technical viability, economic viability, and scalability. The IEA released a status report on demonstration projects in 2009. Coal is an important source of natural gas, Coalbed Methane (CBM). Coal can also be made into diesel, "coal to liquids". Sasol (SSL), based in Johannesburg South Africa, is a leader in this technology. (See Fischer-Tropesch process). Coal can also be burned in place, underground, a technology called UCG (Underground Coal Gassification). This has happened accidentally many times; for example a map in the article comments depicts many coal seam and coal mine fires in China; and coal fires have occurred worldwide over time. Work is ongoing now to create controlled burn. This could allow use of previously-unrecoverable reserves, potentially even deposits under the ocean, with good economics. It also eliminates problems relating to ash and slag disposal. Linc Energy (LNC.AX)(Australia) has numerous presentations on this technology, including this one. US coal production and equipment companies are shown on the Industry Structure page on this site.
Energy Source-to-Use
Efficiency of electricity generation from a fuel determines the volume of the fuel used to generate the demanded amount of electricity. This then is a key factor in the cost of the electricity, and the emissions profile to generate it. Note that solar PV electricity generation does not use a heat engine nor an expendable fuel, so electricity cost from PV is determined by different factors than it is for hydrocarbon fuels. Electricity customer cost varies by fuel used and therefore by state. I'm looking for a good reference on $/KWh by fuel. Here's a start. Also, see power generation cost table above. EIA energy use reference. Petroleum RefiningRefining capacity is as critical to energy supply as is supply of crude oil. Refining is highly capital-intensive, and bears much of the effort of environmental compliance. Crude oil itself comes in varying chemical compositions, which affect processes used to refine it, and also affect the economics. Refining petroleum yielded the following product mix by volume in 2005:
This can be stated as the "3:2:1 rule-of-thumb":
References:
Petroleum Import/ExportFollowing is a summary of petroleum import/export to the US, EU, and China. The chart does not include petroleum produced in a region and consumed in the same region. The chart includes only oil and does not include coal, natural gas, nuclear or other sources. Units are Thousand Barrels of Oil Per Day (K BOPD).
Political influence and mutual dependence are important factors on both sides of large trade! Power TransmissionMost power transmission in the US is on an AC grid. AC is used because of its cost and efficiency, particularly when used with generation sources using steam turbine generators to generate electricity from coal, natural gas, nuclear, and wind sources. There is a detailed discussion, on the Transmission page on this website. NuclearFirst, some overview information:
An article from the Cato Institute discusses economics of nuclear power. Nuclear plants are relatively cheap to operate, but require large up-front investment on the order of $6-9B USD. Nuclear plants satisfy 24x7 base-load electric capacity. Gas plants on the other hand cost several hundred million $USD, and can be turned on and off more conveniently thus making them more suitable to supplying peak power sold at a higher price. Nuclear plants are thus riskier to investors. The article further describes government financial aspects that discourage economic operation of nuclear plants, and concludes that plants operating in France, India, China and Russia are driven by government rather than by economic operation. Companies involved in construction of nuclear power facilities.
Concerns about nuclear power have included safety of operation, weapon-ization, and waste disposal. New technologies have been developed that promise to alleviate some of these concerns. Exploration into use of Thorium reactors has shown that it produces fewer long-lived by-products, is abundantly available in many countries, and may not produce weaponizable material. Reactor technology includes liquid-core liquid-fluoride-thorium-reactors (LFTR).
Mini-reactors the size of a phone booth with a uranium hydride core surrounded by a hydrogen atmosphere, are a technology being pursued by Gen4 Energy (previously Hyperion Power Generation) (Los Alamos, New Mexico; Denver, Colorado; Washington, DC USA; London, England). Each reactor is self-contained and acts like a battery, producing 27 MW of thermal energy. The reactor is self-regulating and would be connected to a steam turbine. In addition to bulk electrical production, the portability of this device lends itself to power required for recovery from oil sand and shale deposits.
The Traveling Wave Reactor (TWR) is another self-contained reactor technology, currently being developed by TerraPower, a subsidiary company of Intellectual Ventures. A TWR is initially constructed containing only a small amount of enriched uranium, which is used to initiate a chain reaction in a core composed of depleted uranium. The fission reaction travels as a wave through the core essentially creating its own fuel along its way. This process reduces fuel needed, reduces waste, and thereby is less prone to proliferation of nuclear material. Depleted uranium used in the core, mostly U-238, is a waste product of uranium enrichment to produce U-235 for other reactor processes. Bill Gates of Microsoft is a principal investor in TerraPower, who are developing this technology in a newly-forming partnership (2010) with Toshiba. Industry Structure
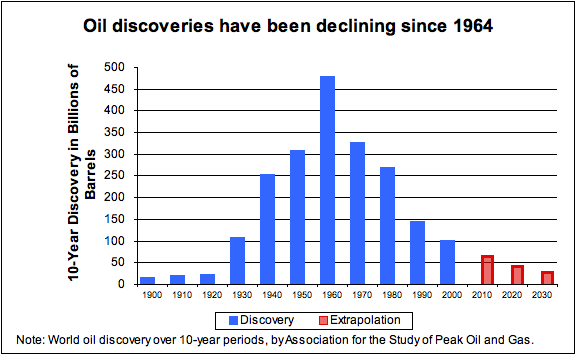
Supply: OutlookAt a first order, production is done first from lowest-cost reserves. Cost includes all factors of extraction including exploration, drilling, production, transportation (pipeline, tanker, storage, etc.), capital equipment, expenses, and labor. Gradually, lowest cost reserves are used up and higher cost reserves are tapped. Technology innovation gradually reduces cost; for example recent examples include directional drilling, multi-hole wells, and computer-imaged seismic exploration. On the whole, as demand has increased, exploration and extraction costs have gradually increased as well. As costs increase and the market supports the higher cost, additional sources become available. Examples will include oil sands, and ultimately alternative energy sources that are comparatively higher-cost today, such as solar. This sounds generally positive, technology continuously improves to provide access to huge un-tapped reserves that support the world's economies for years to come. This is what we are addicted to. But notice that the cost of production relentlessly increases to make this possible. And clearly higher energy cost has an effect on economies. Here's an interview on CNBC with Jeff Rubin on this topic. Read the comments below the video as well for some additional perspective. This article at The Oil Drum echoes many of the underlying theses discussed on this site. Further, the article discusses how currently-restricted credit availability affects investment, and in particular the effect on production. Analysis of planned oil projects predicts slowly declining oil production. It is important to consider that availability of oil at prices consistent with current levels of world economy may well be a far more imminent problem than is climate change. The commentary following the article provides a wide-ranging and eye-opening discussion of the future of energy and the economy, clarifying Peak Oil as a continuing event that has already begun, and that we are experiencing now if we know how to interpret it. A very important read. Discovery of new oil has been declining for some time despite technology advances including hydraulic fracturing, directional and multilateral drilling, 3D seismic imaging, submersible pumps, and polymer and surfactant flooding. To some degree, this is a result of lack of investment during periods of low profitability. Limitations to availability and drivers to price include include new discovery rate and discovery investment rate, production rate and production investment rate, and growth in demand relative to growth in supply. 
Figure from The Oil Drum in this article, based on the work of Colin Campbell for ASPO. It is for this reason that this site makes the argument that Supply is Job One and needs to be addressed by developing renewable sources much sooner than later, in addition to exploiting non-renewable sources while those are developed to scalable economic sustainability. The data presented on this website indicates that the need for mature renewable sources will be increasingly obvious as we approach 2030. In the longer term, an important consideration is Peak Oil, proposed by M. King Hubbert in 1956. There is a large body of knowledge on this topic available on the Internet. Oil taken out of the ground is analogous to puncturing a tire. Pressure is high at first, but declines exponentially. Oil producers manipulate the bore to promote conduction of oil and/or gas, and may pump water into the well to raise pressure on the oil. More holes are drilled. Nevertheless, in aggregate the well production rate declines over time as does the production rate of its oilfield. Ref: Association for the Study of Peak Oil & Gas - USA.
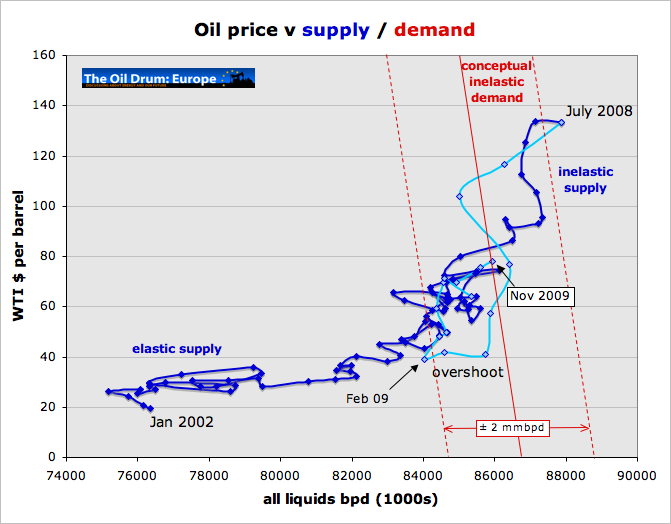
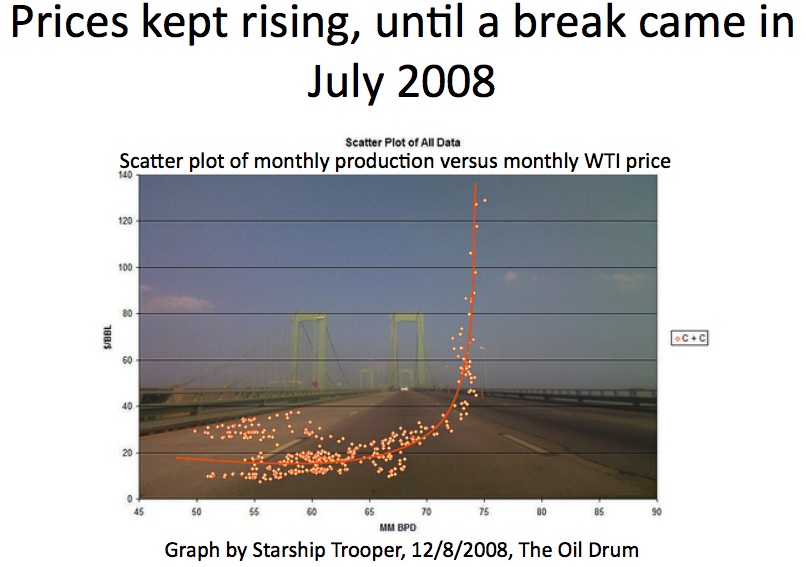
(19 Aug 2010) Spare Crude Oil Capacity, from The Oil Drum. As of this date, "spare" production capacity by OPEC is estimated at 2 Mb/d (million barrels per day). This covers approximately one year's growth in worldwide demand for petroleum. Non-OPEC suppliers achieved a plateau of supply in 2004, balanced with OPEC supply/demand. Supply from OECD countries has been declining slowly. Imports into OECD countries declined in 2008-2010 but have resumed growth. Oil price has remained relatively high, $70-80 despite modest demand growth suggesting that price will rise as demand grows. Despite several production-constrained oil shocks and promises of increased production, in practice increases have not materialized so there is reason to think that worldwide production is approaching its peak. A model projects oil depletion for major suppliers:
There is no way to know just when the peak will occur. Technologies may extend the timeframe. For example, the US currently needs light sweet crude which is the rarest; greater use of heavy sour crude is possible although it takes additional effort to make it environmentally acceptable. Refiners like Valero (VLO) and a few others are equipped to refine it. The timeframe of decline may however occur as the worldwide demand increases as the major economies grow. The models and predictions indicate we will be into this decline for oil by the second half of the current century, i.e. within the timeframe of current decisions to develop and deploy energy solutions. Production peaks can likewise be predicted for natural gas, coal, fissionable material and other key materials. See this Wikipedia article. Carbon Capture
ReferencesEnergy data is from BP (BP) annual report on energy production and utilization statistics, combined with data from other sources cited where used. Energy Information Agency Annual Energy Review, US 2009 and petroleum tables Daniel Yergin is co-founder and chairman of Cambridge Energy Research Associates acquired by IHS Energy in 2004. His book The Prize outlines the oil industry with great insight. White papers on energy topics are available on the CERA website. Wikipedia World Energy Resources and Consumption CO2 emission per metric ton and kwh Energy Export Databrowser, by Jonathan Callahan |


