
MEET FEATURE REQUIREMENTS, SCHEDULE, and BUDGET! Consulting available to teach your organization to apply this methodology and tools for powerful quantitative management of your business processes.
- Instruction of your staff at your site, using courseware, application example, and a functional template.
- Mentoring your key staff on an ongoing or periodic basis, on these tools or on Quantitative Program Management.
- Contracting or Employment in your organization on specific topics.
Check out my YouTube Channel: Power Operational Intelligence
Now Live! Overview, Structure, Task Data, Table Design, SQL Server, and Re-Linking now showing.
Video courses covering material on this website, and more, are presented in the playlists.
Code snippet links at YouTube Code Snippets. Twitter at @poweroperation1, #poweropi, #poweroperationalintelligence.
Subscribe on YouTube, and click the "Notification" Bell icon to be notified as content is published.
Tools for Multi-Dimensional Problems Using Excel with Access or SQL Server
Excel gives computer users access to great computational and data handling capability, with no real programming knowledge. So there is a wide range of problems that people have aimed Excel at - and a wide range of quality of solutions.
I think Excel is best at handling "flat" problems, ones that can be represented as an M x N table, and that often Excel solutions get cumbersome and complex as people try to deal with real life problems that aren't well represented by such tables. Excel is so flexible and powerful that usually it can be done, but the solution may be over-complex, cumbersome or brittle, or inextensible, difficult to support, or may not use the true power and beauty of Excel.
In many cases, the problem to be solved may change over time, and the size and shape of tables may change including more records or more data fields, or may be incrementally expanded for use in additional situations as they evolve. Excel solutions tend to become brittle as this occurs, as extensive maintenance is needed to keep existing calculations pointing to cell ranges correctly, or as additional calculations cascade to multiple worksheets or even to inter-connected workbooks. Using Excel with a database provides quite cleanly for expansion, contraction, re-structuring, adding and customizing the solution implementation.
Interestingly, you can build really powerful and elegant "No-Code / Low-Code" solutions to non-flat problems by using Excel with a database. Limited background or training in coding or SQL are needed, to set up use of this methodology and toolset; none to use it once the system is set up. Access comes as part of Office, and SQL Server Express is free - so databases are accessible. I haven't used MySQL but that should be easily available too.
Most people don't have a very good idea what Access is or how to use it and may be a bit intimidated by it. Turns out Excel isn't hard to use with a database, and following are some notes about how to do it. Access is the easiest to use because it has built-in integration features, includes built-in UI features, and is programmable with VB if you want that - but you can do a lot using Excel as the UI, and without needing to use VB.
SQL Server needs a bit more knowledge and at least basic SQL to build queries, but again you can get a lot of power without getting too deep into SQL. I've given book references that will help.
The example below uses Excel for data input. Nearly all users are familiar with Excel, and this can save you a lot of effort creating a UI in Access or .NET. Local calculations can be made and controlled by the input users. Excel can give your users too much control, but if your target users are program core team members or line managers this is almost always manageable.
The database query fetches data from Excel, combines the multiple data sets (for example, test configurations, wafer and lot designations, package information, and yield data) to create build instructions (for example).
Excel pivot tables driven by query output provide powerful reporting capability. Excel pivot tables are quite functional and have excellent formatting for useful reports.
Data analysis for the Energy Economics pages on this website is done using the techniques described here, illustrating data analysis capabilities. I've also used this structure to actively plan, track, update, and manage organizational budget and PO tracking, and also to manage custom chip development test planning and materials including die and wafer configuration and inventory, module builds, test platform configuration and builds, and test sequencing and scheduling.
Excel: Set up input data
Data is contained in Excel structured tables. Each row in each table has a Line Number field, shown at left, containing a formula to give the row number. Name that field using the intended name of this table, resulting in something like "ConsumptionLineNo". In the example below it is named "Sheet1LineNo". In fact, I recommend using this practice for all fields in each table to make the names unique among tables. This will avoid name conflicts in subsequent steps, as well as help clarify the source of output data in queries. The formula is shown below the data, to illustrate how this is done.
MS Access can link Excel input from Named Ranges containing Excel absolute cell addresses. Access doesn't see Excel Structured Tables, which would be very useful for input to Access, because they re-size automatically and support Structured Reference syntax. But VBA code can create a named range that overlaps a table area, and keeps it updated as data is input to the table or if rows or columns are added. Each range will have the name of its associated table, prefixed by "xl" or "rng"; for example "xlTablename", and that range can be chosen as shown in the step shown below named "Access: Choose the Excel data source." Any number of these linked ranges can be set up, one or many tables per tab on any number of tabs, and they will be automatically updated as data is added/updated/deleted in each table, making use of Excel Structured Tables linked into MS Access automatic and transparent!
At this step is an opportunity to clean up the data. Decide how you're going to handle blanks; out-of-range, spurious, or malformed data; numeric vs. character data; dis-ambiguation (e.g., North Korea; Korea, North; and DPRK are no doubt the same entity. Are Bill Gates and William Gates the same person?). Also, structure your data so you can take in a wholesale update when needed. If your project is successful, you'll want to put in data for the next fiscal year; or the next project; or another organization. I make it a rule to never "touch" original data input. Rather, I accept data in whatever form it is given, and create and run programmatic clean rules to clean or structure it, in Excel or in Access. Then when I get a bulk update, I can insert it into my project and run the cleanup rules against it.
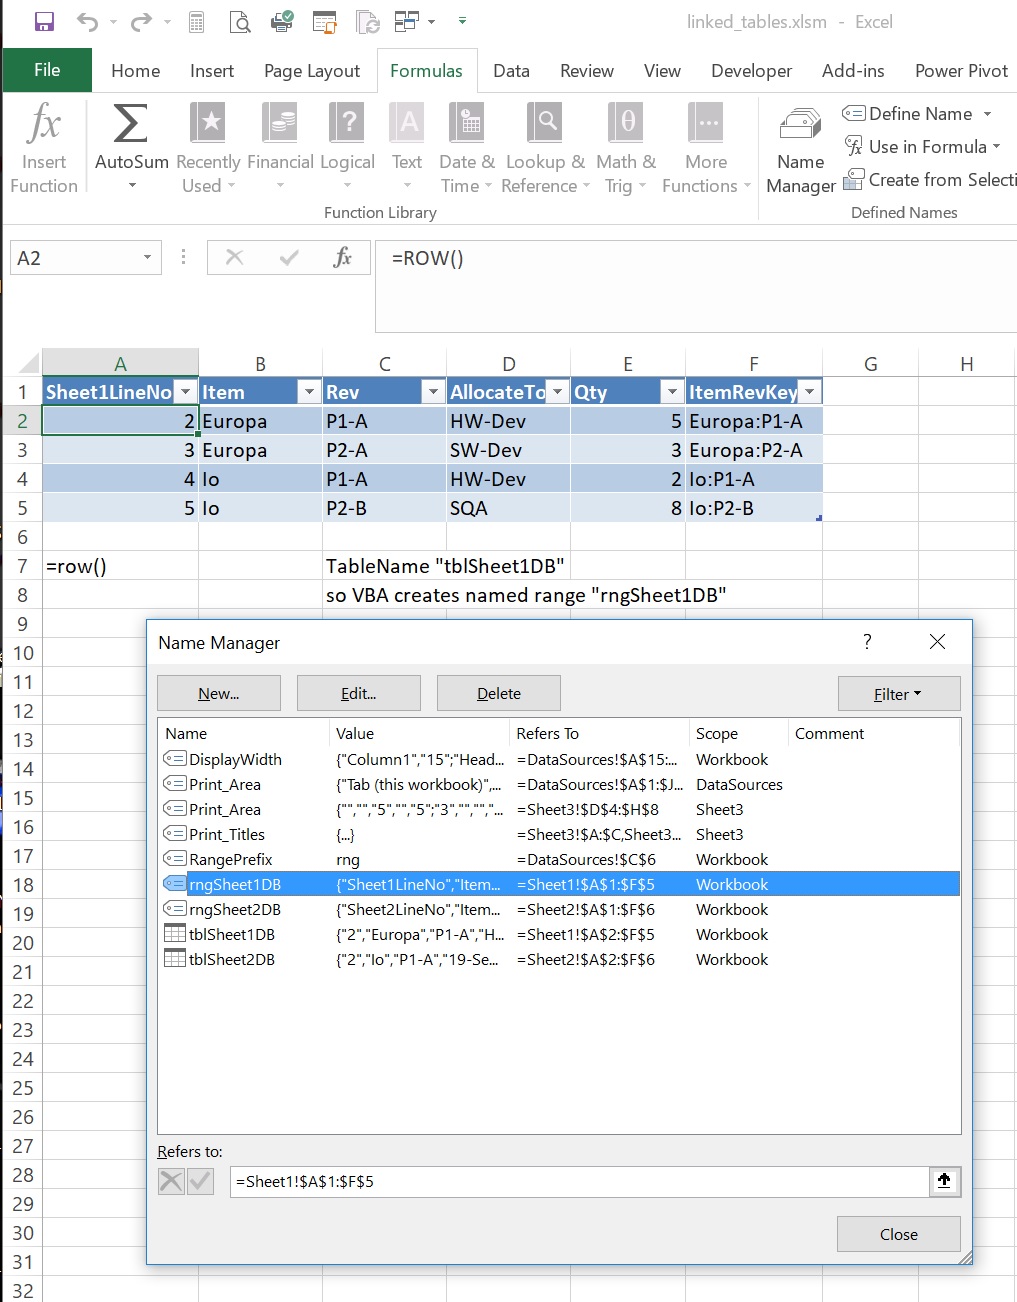
VBA code for the tab/worksheet containing the Structured Table creates and maintains a named range overlapping the current Table area, and that named range can be used to effectively link the Structured Table into MS Access. The table names and field names in this example are generic but of course you can name them anything useful to you, and the range names will follow. A Table named "tblConsumptionDB" would have a shadow named range "rngConsumptionDB" created by this VBA code and following it automatically, that you can link into MS Access.
>Access: Create tables linked to input Excel tables
Close the Excel file, and open Access. Create a new database and open it.
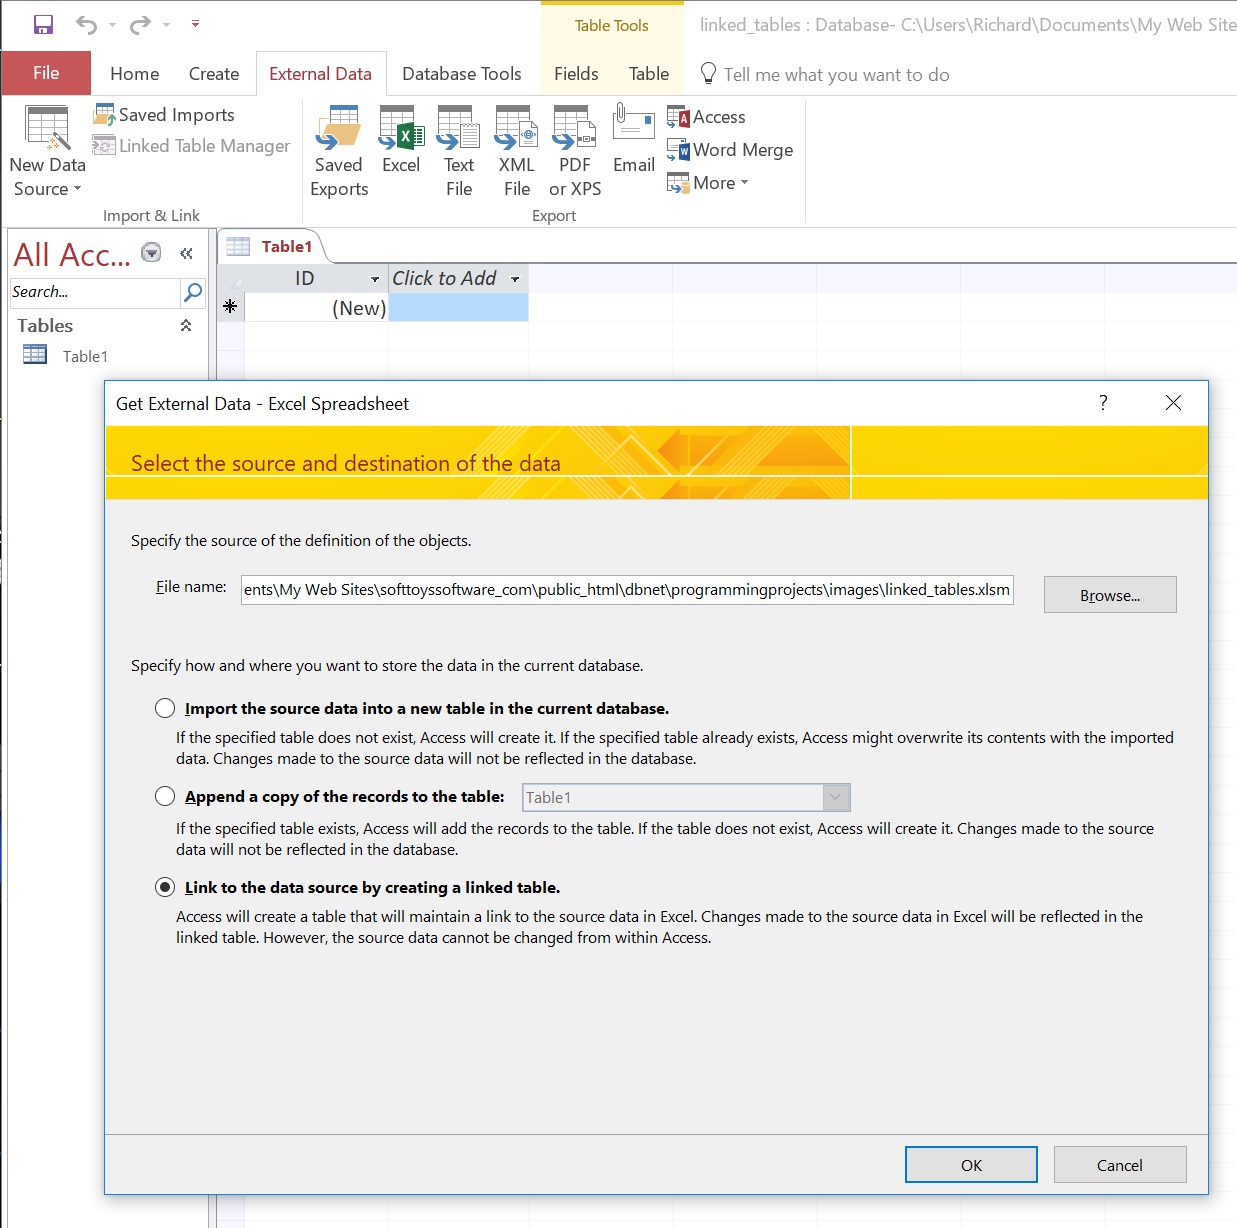
Click "External Data > Excel" on the Access ribbon. Enter the Excel file name, and choose "link" on the panel shown below. When you add subsequent tables you will be given a choice to append data to an existing table in Access, but you should continue to use the "Link" choice for each table you add.
Access: Choose the Excel data source.
Select "Show Named Ranges", and select the range specifying the table you are inserting.
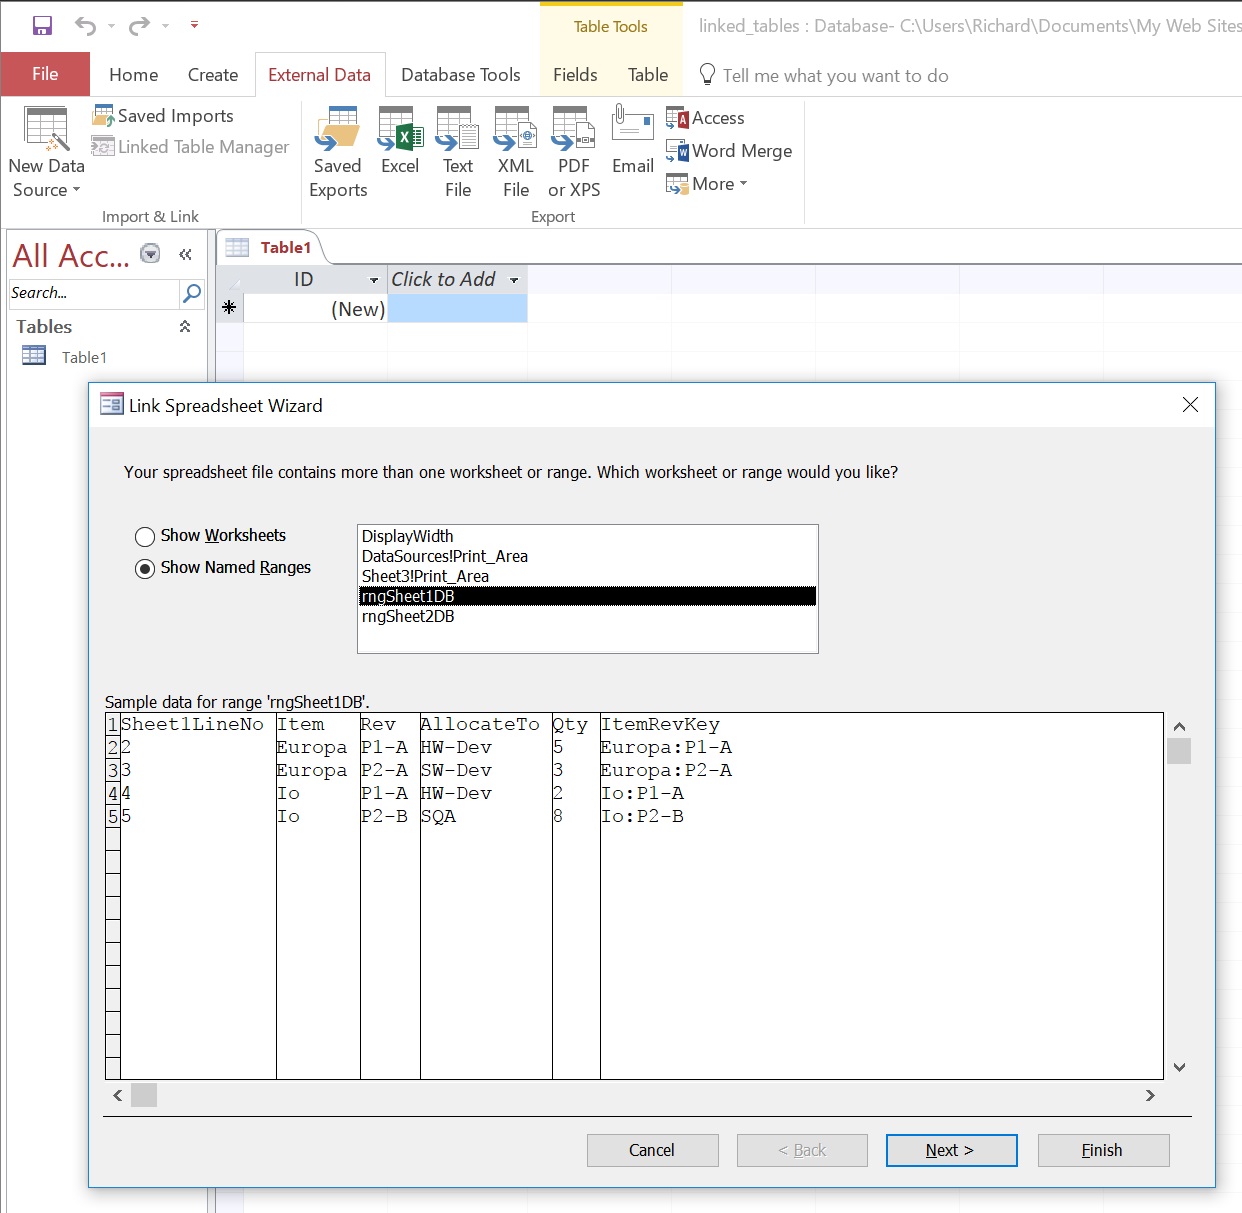
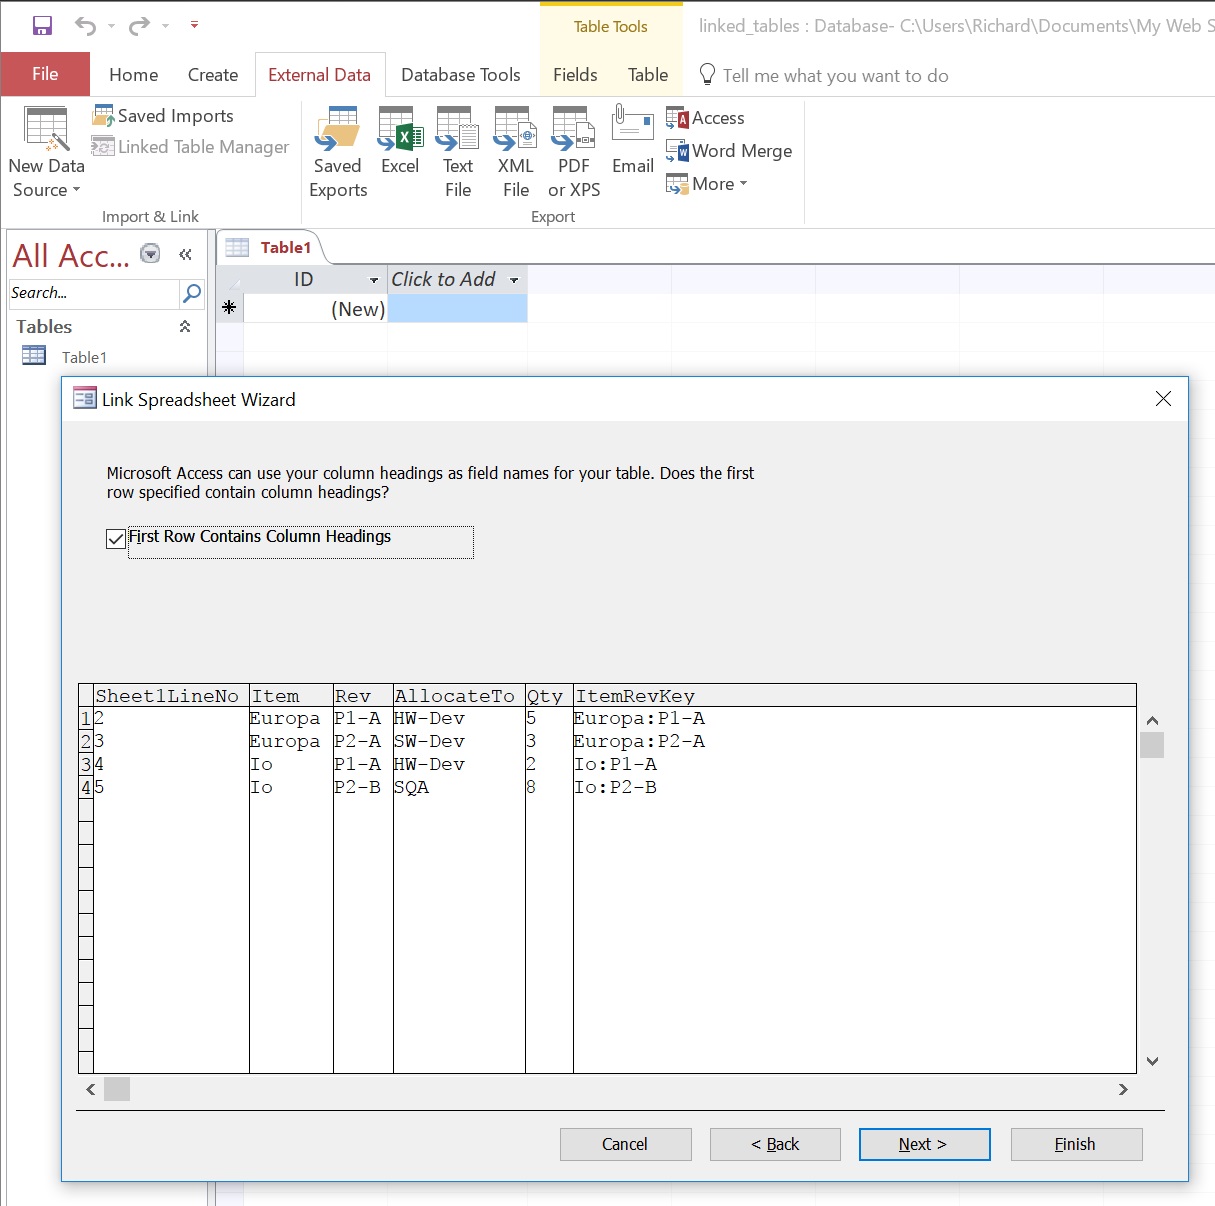
Check the box for "First row contains column headings" on the following pane.
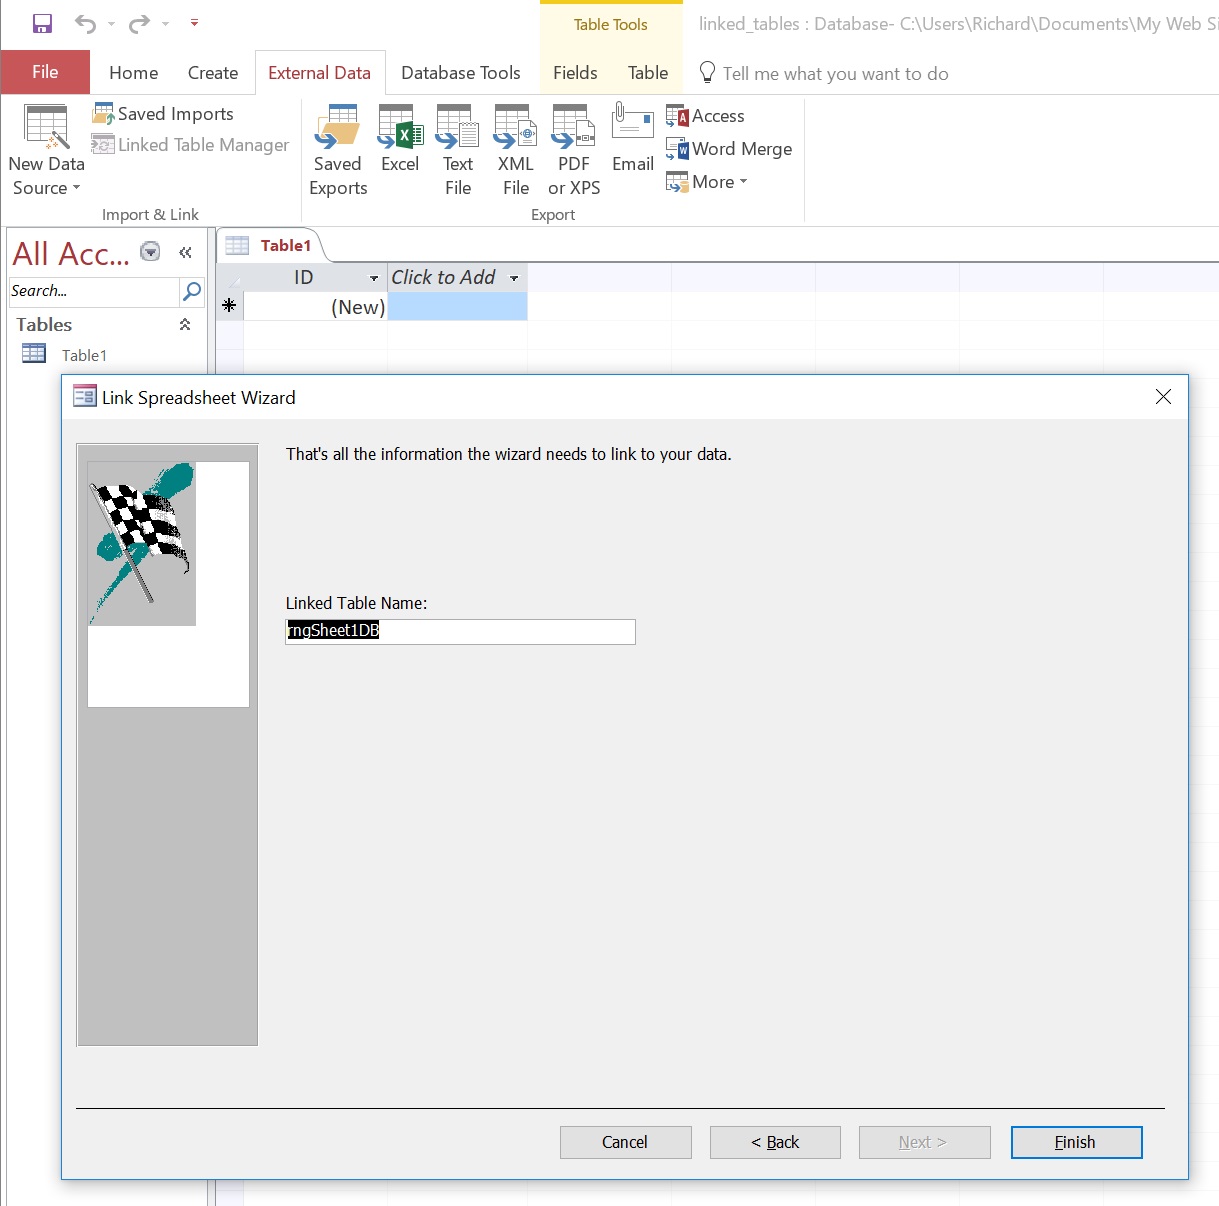
Name the Access linked table. Then repeat all the steps above and link all other Excel data source tables.
Access: Create a Query to Link Tables and Create Output Table
The following section shows how to use the MS Access graphical editor to create and link QUERYs. If you're already familiar with SQL, you can create your QUERYs in Excel and call them directly from Excel using a Data Connection. That is described in a section below.
Select "Create > Query Design" in the Access ribbon. Select one of the tables of imported data set up just above.
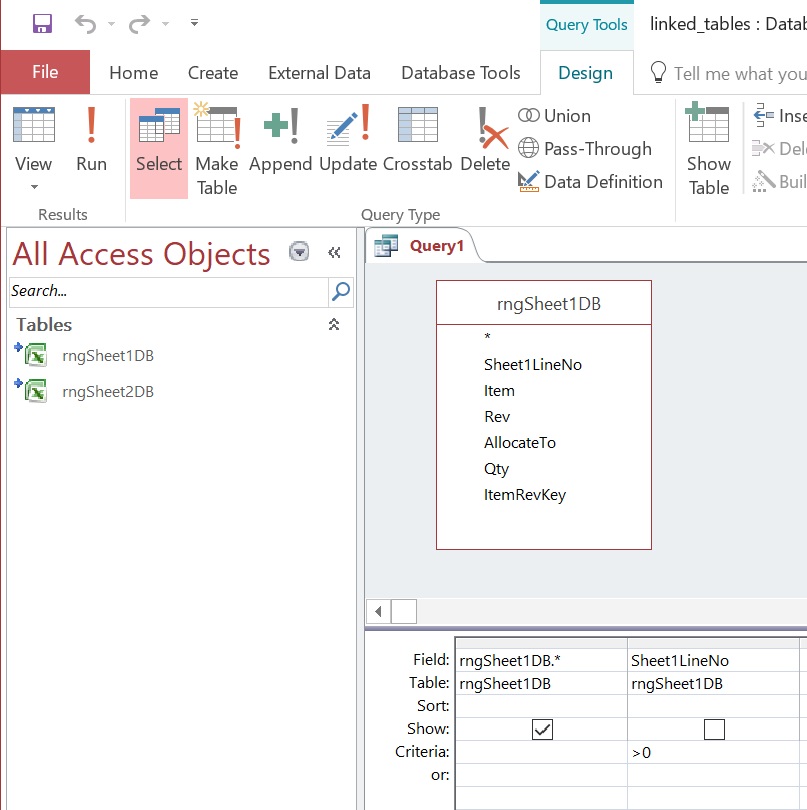
Drag the * symbol from the table pane into a column of the design pane, to include all input data fields. Also drag down the appropriately-named "line number" field to another column of the design pane. Click in the "Field" cell in the column for that field, and prefix the name with something like "LineTest: ". In the "Criteria" cell for that column, enter ">0". Un-check the "Show" checkbox for this "LineTest" field. The figure below shows the resulting query design. The "LineTest" field will not show in the query result, but will filter out any rows with line number set to 0 or a negative number, allowing some filtering.
You could do other selection criteria and manipulations here, such as selecting years greater than 1980 for example, if you had a year field and wanted to eliminate those earlier years. You should also complete any data clean-up within this step, so that you can reference this query in subsequent "work" queries knowing the data is cleaned and structured in final form.
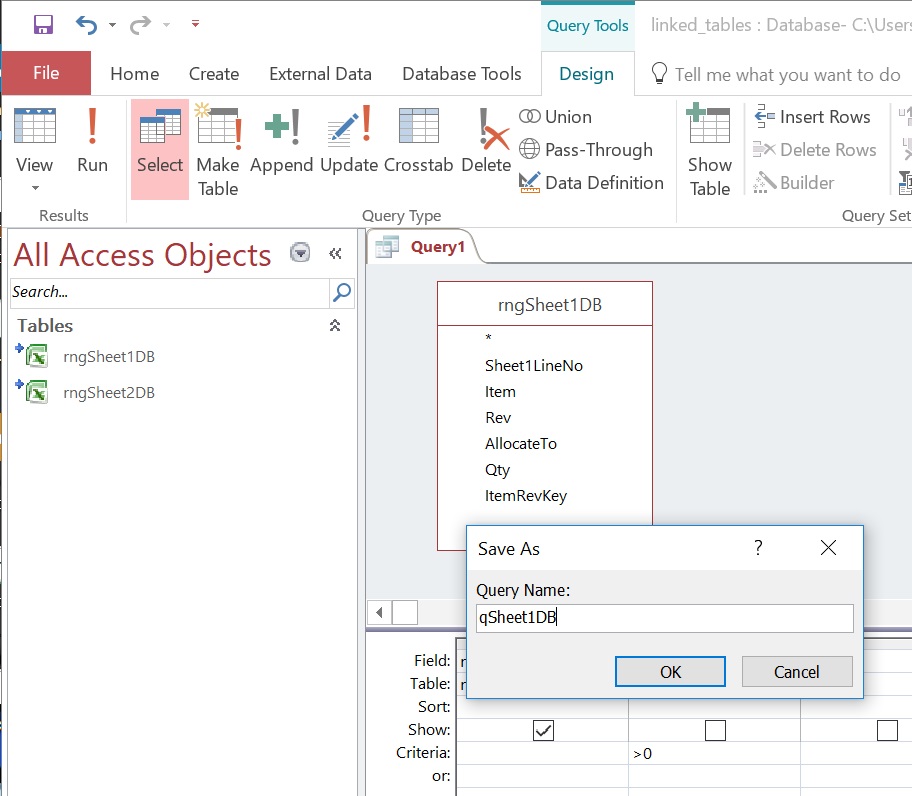
Now save this query. Right click the tab above the design pane, select "Save" and give it a name. I suggest using the name of the table, prefixed by a "q". From here on, this query will be used instead of the linked table, to reference data for this table linked to Excel.
Repeat these steps for all input tables linked to Excel. The result is a query representing each linked input table, but filtering out the artifacts included in the Excel table design that were helpful for data input in Excel but which will not participate in the following data analysis.
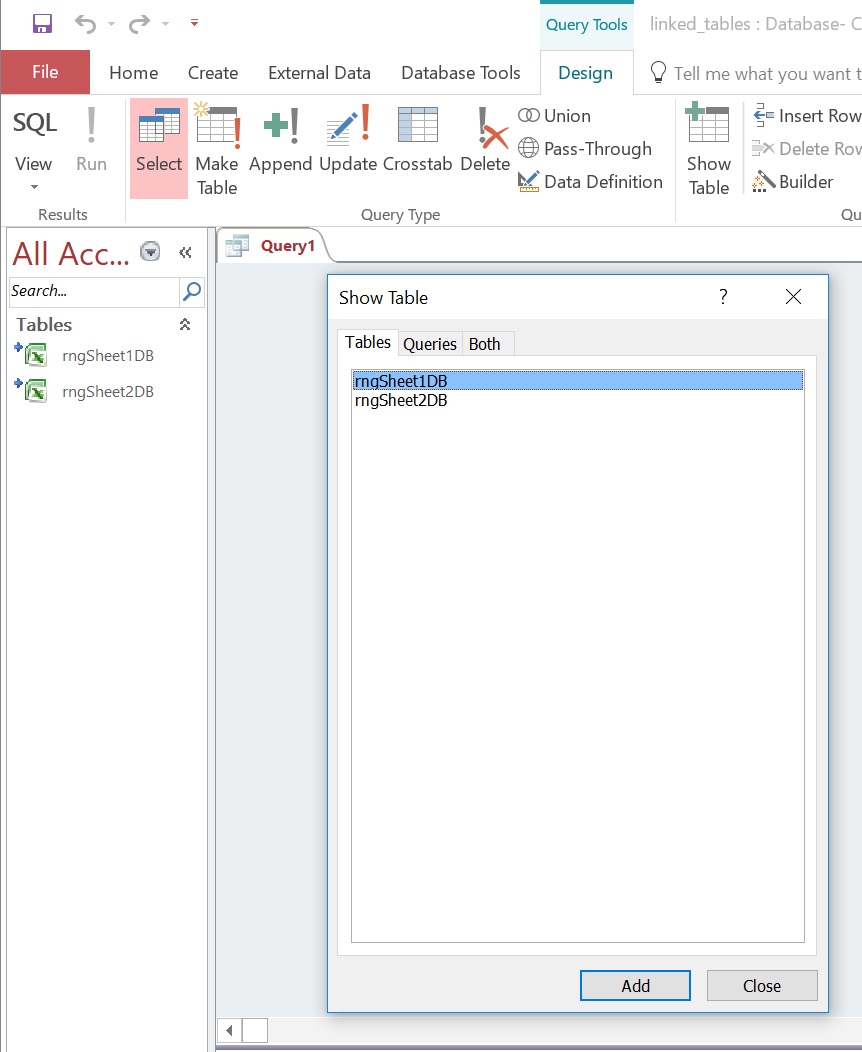
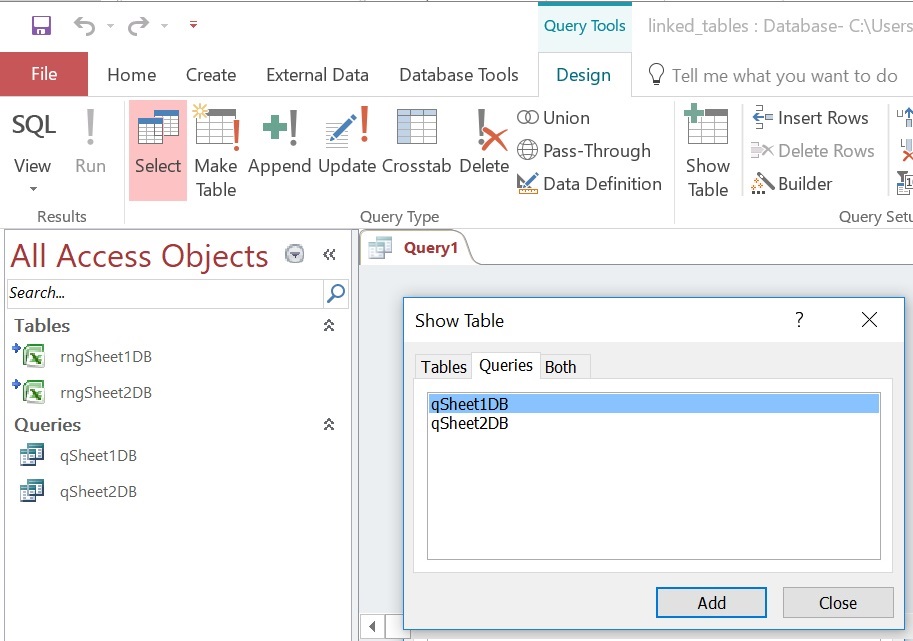
Now to create a useful data analysis query. Click "Create > Query Design" in the Access ribbon. The "Show Tables" dialogue shows. Select the "Queries" tab, and select appropriate queries for the linked Excel data. You can also select other tables that you keep in Access if your query design needs that. In this example, we will link two tables from Excel so we insert both queries into the new query. See just below.
Drag fields needed for query output, down to field output columns in the design table. Use the "*" symbol to include all fields from an input query or table. (The reason we named the "LineNumber" fields in the Excel data to be unique among the linked tables, was to avoid naming conflicts if we do this to include all fields in the query design.) Link fields in the tables by dragging from one to the other. This is a pretty simple query to link two tables, but more complex queries can be built in this step. Refer to the Access books referenced. Access provides a graphical interface that simplifies building queries. If you're using SQL Server you write these queries in T-SQL. You can also use SQL in Access. However, simple queries like this example will be sufficient for many practical problems.
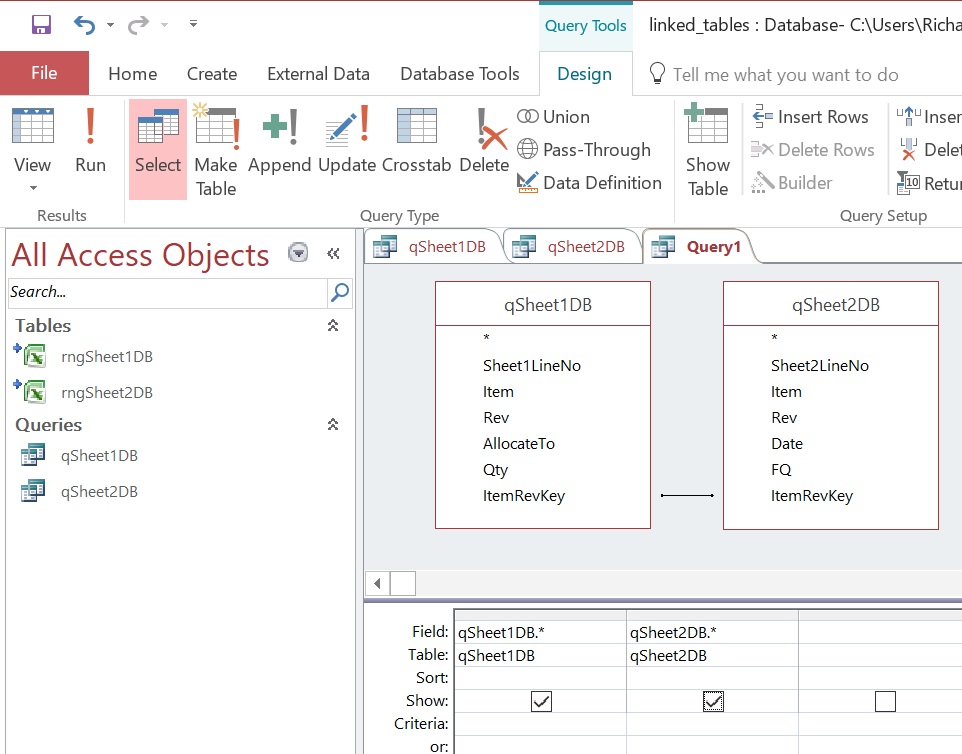
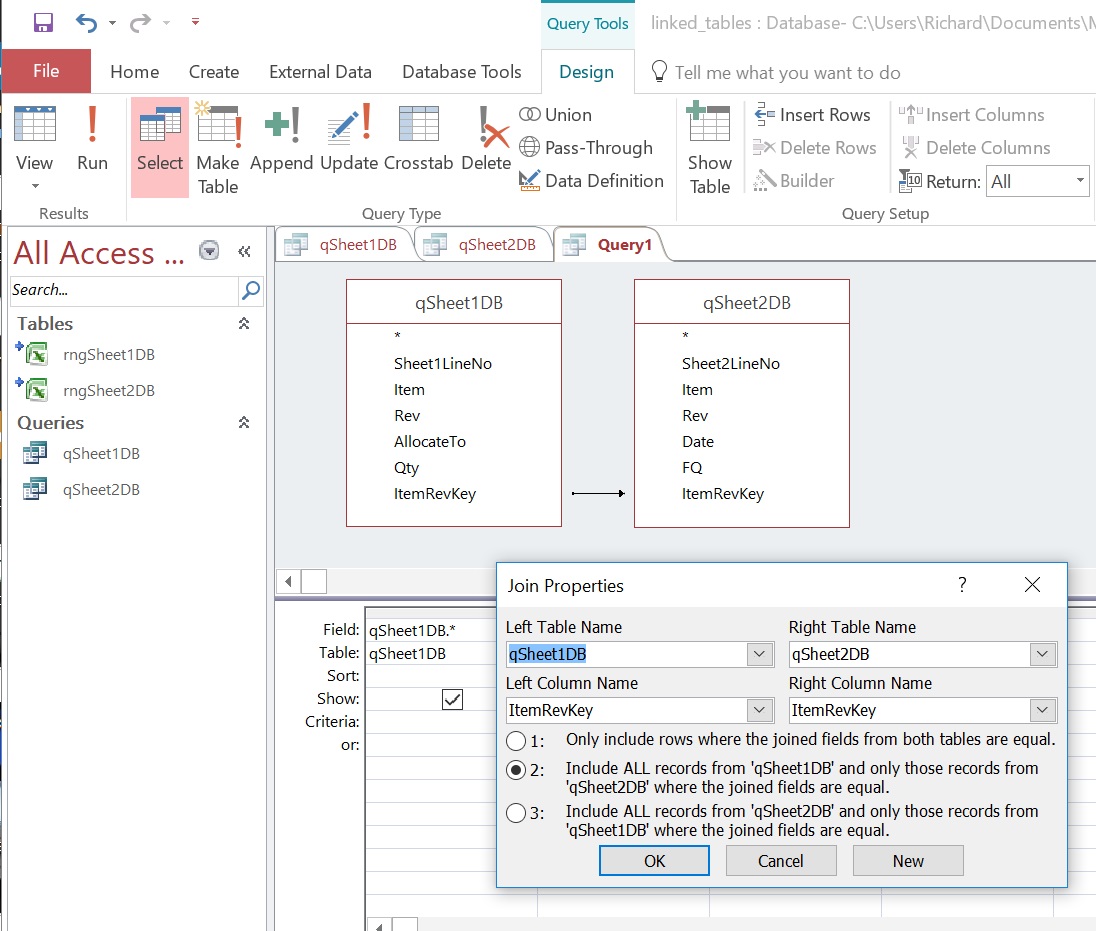
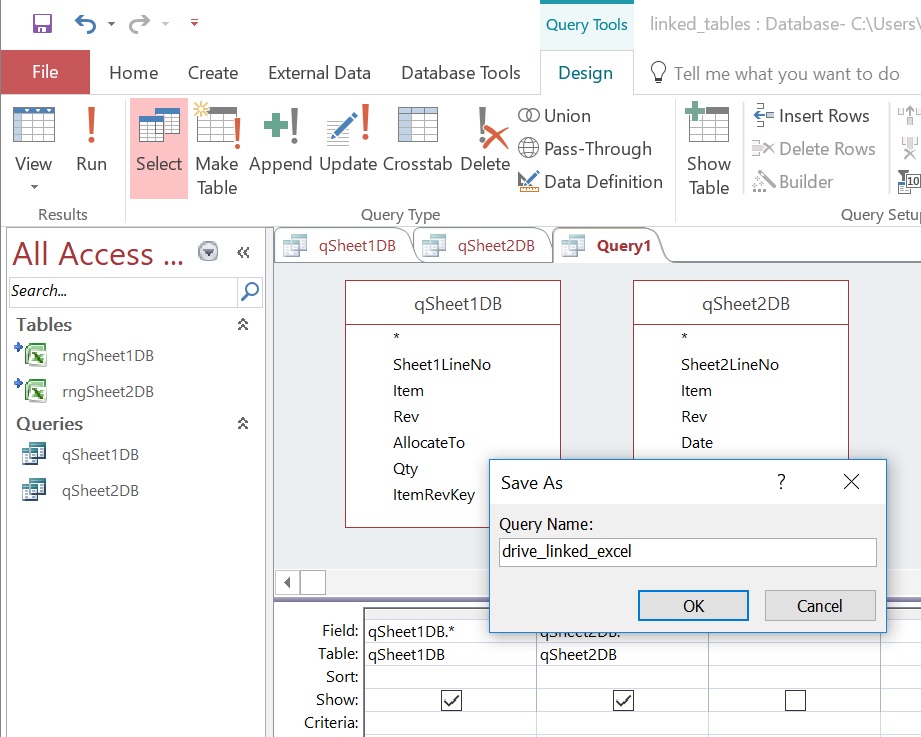
Here's where the Access book will come in handy. Simply put, if you use the default link shown by the straight line in the figure above, query records will be produced only if there is a match between the linked fields in qSheet1DB and qSheet2DB. Below, I've right-clicked on the link. The selection shown will produce records where qSheet1DB.Column1 field entry matches the qSheet2DB.Column1 entry, and also for all records in qSheet1DB that don't have matching entries in qSheet2DB. You'll see the result below in the finished query.
You can compute fields in this step, and set criteria to limit records based on field values. For example, you could only produce a record if the value of field qSheet1DB.heading2 is ">10". To create a calculated field, right click in a Field entry, and select the "Build..." option. From that dialogue you can select fields from tables and queries, use built-in or user-created (VB) functions and so forth to build complex expressions. An expression might look like "exprName: [table1]![field1] + abs([tableX]![fieldY])".
Save the Query just designed. Right click its tab above, select "Save", and enter a name. You will access this query from Excel to drive a pivot table to further process and display the data.
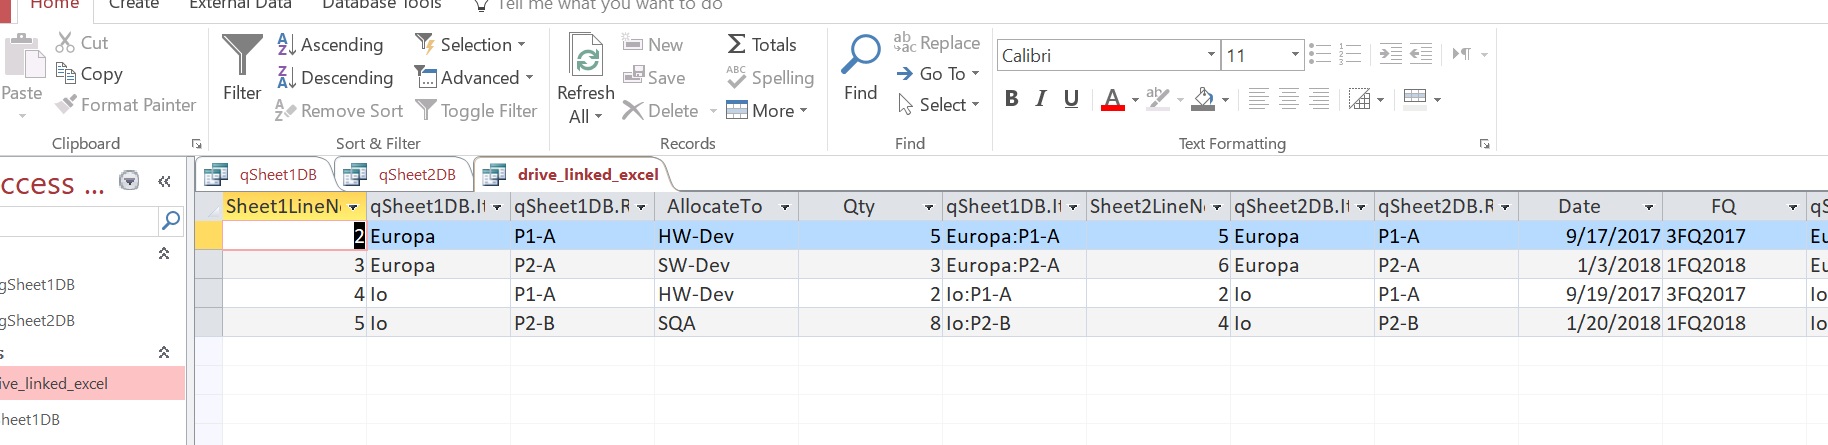
You can examine the query result in Access. In the figure below, we're looking at Table view of the query to see the output.
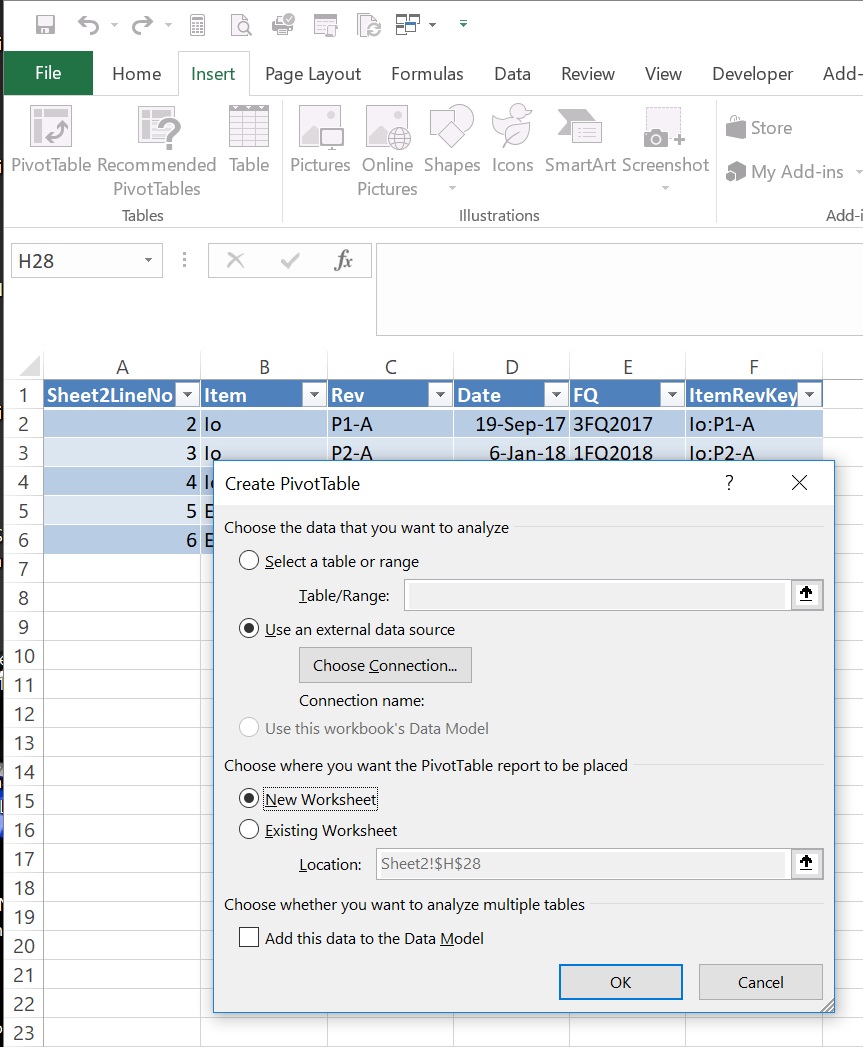
Excel: Insert a Pivot Table
Now use Excel to query the Access result, and produce a pivot table for the results. Re-open the Excel file. On the "Insert" ribbon, select "Insert PivotTable". Select "Use an external data source", and click "Choose Connection...".
(Of course you could instead insert a QueryTable or PivotChart using nearly the same procedure as will be described.)
If you have previously set up a connection to the Access table you're going to use to drive thispivot table, you can select it in this pane.
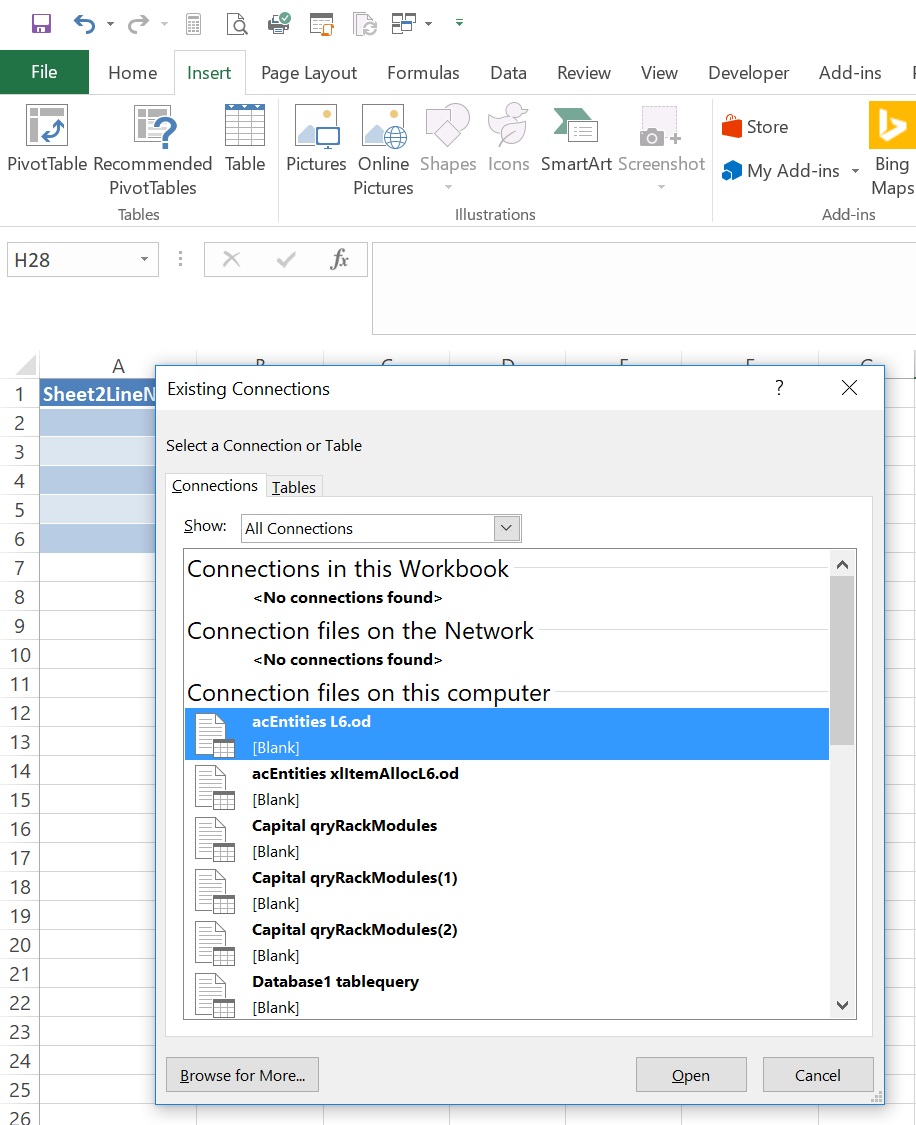
If you need to set up a new connection, click "Browse for More..." and go browse for the Access database.
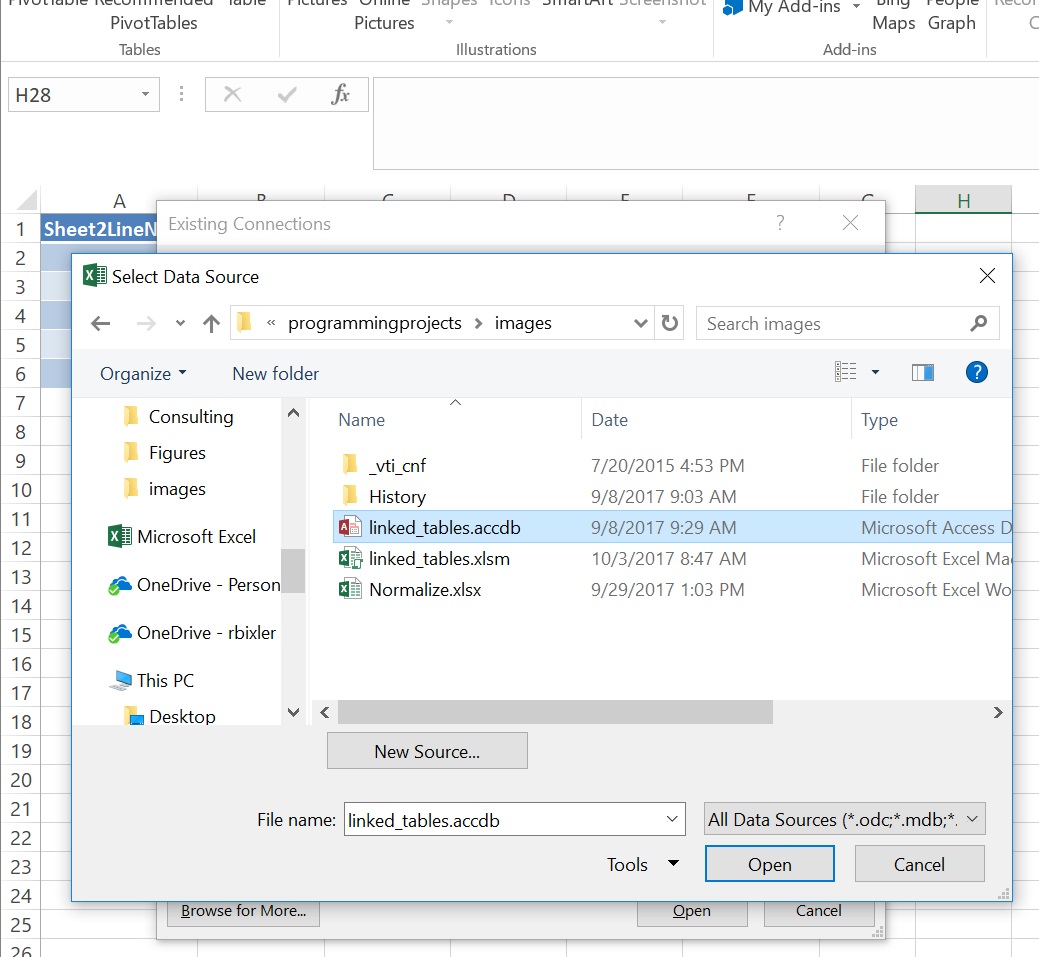
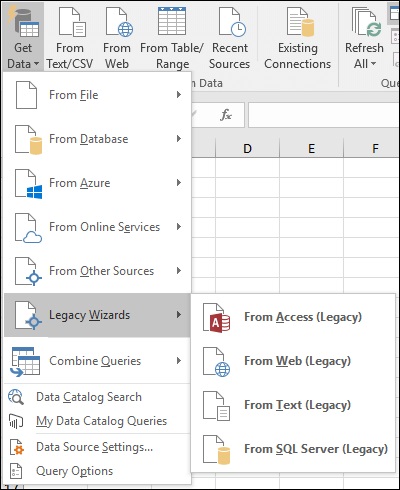
This is Excel so there are several ways to get to this Select Data Source pane... Another way to set up a Data Connection to drive a PivotTable is to use the MS Access Data Connection Wizard (Legacy) which provides several functionalities.
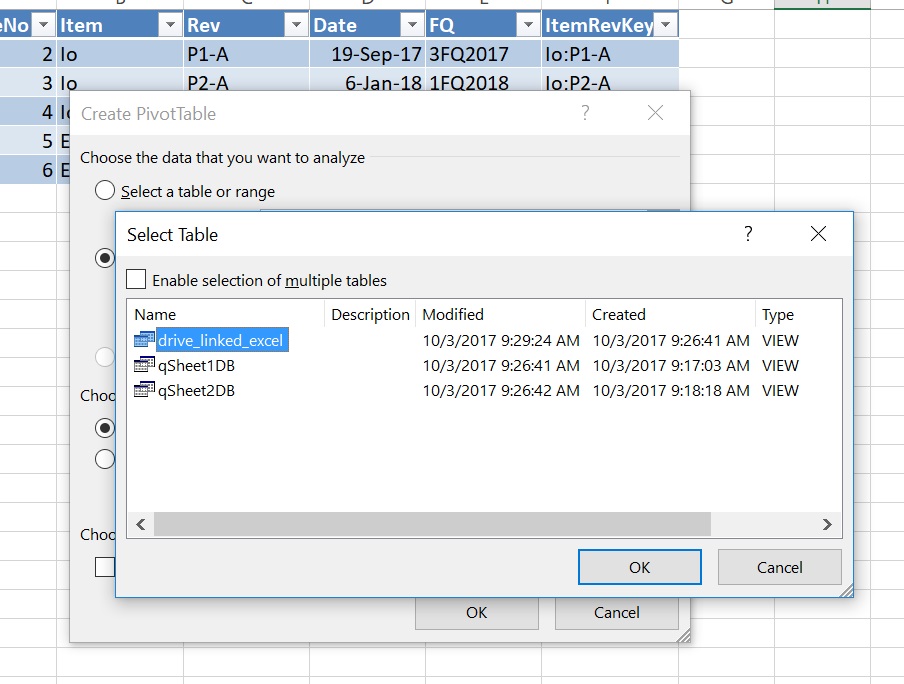
From the Select Data Source pane, select the appropriate table or query to drive the pivot table. In this example, we select the analysis query created in recent steps above.
Note that an Action Query in Access, such as a UNION query, will not show here for selection by Excel. If your solution contains such a query, you can build a SELECT query to wrap the Action query (select "*" to put all Action query fields into the Access query fields, as in "SELECT * FROM hiddenQuery" where hiddenQuery is the Action Query you're wrapping). The wrapper SELECT query should then be selectable from Excel and give you access to the hidden query.
Also, I've found it sometimes difficult in Access to use Outer Joins using a multi-field compound key. So in the Excel input table, you can create a field to synthesize a compound key, concatenating the fields desired for the compound key. For example, create key values such as "itemname:revision:test" (where in this example colons are inserted to maintain readability). Then use this synthetic key in a compound join in a query.
You can edit the properties of the connection by clicking "Data > Connections" in the Excel ribbon. Select the connection you just created and click the "Properties..." button and then the Definition tab to show the pane below. It's useful to add the name of the Access table associated with a query, to the name of the connection. This makes it easier to find and re-use the connection if you design multiple pivot tables from a common Access query.
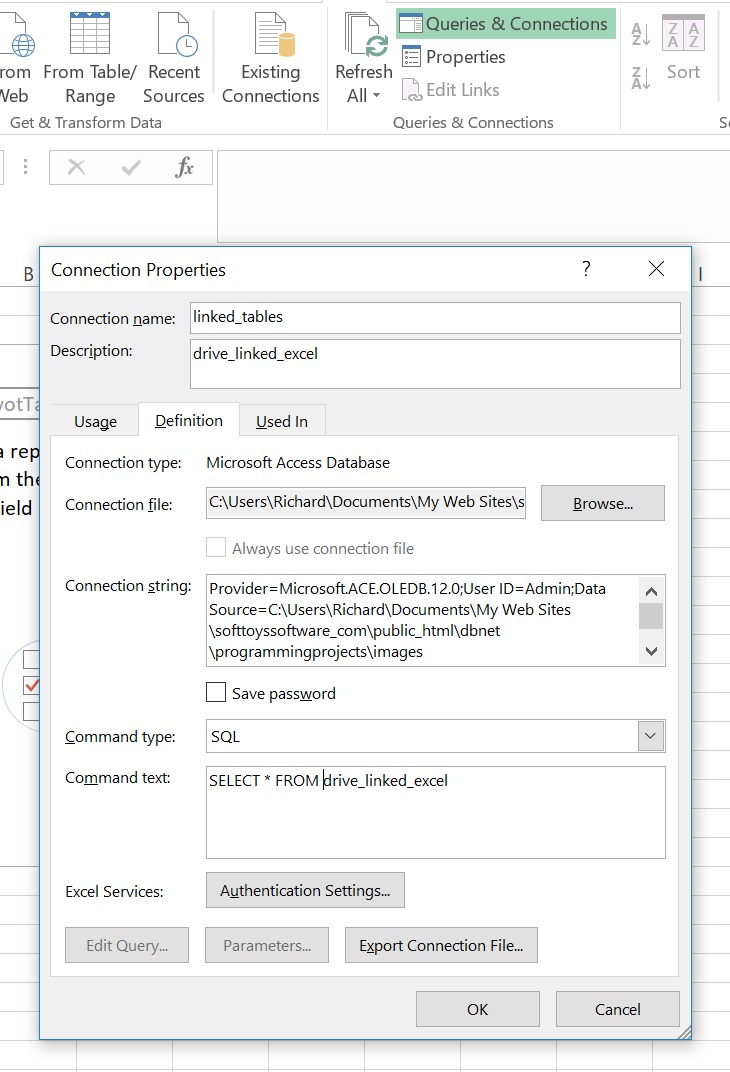
Note that in the figure just above, "Command type" is set to "SQL" and "Command text" is set to SELECT * FROM drive_linked_excel". When you first set up a Connection these are set respectively to "Table" and a the name of the range or sheet in the source you chose. When you re-connect and/or re-locate and reconnect a source into Excel using tblConnectionConfig and the "Link to Database File Specs" button on the DataSources tab, you can specify SQL to be placed into the Connection as Command text as is shown just above. The default SQL, if no other statement is specified in the SQL column of tblConnectionConfig for the connection, is the SELECT * statement shown in the figure above and made to point to the specified source range or sheet. The instructions on the page for setting up SQL used to query SQL Server (Excel-SQL Server) apply also to Access and are summarized below.
Excel: Design the Pivot Report
An Excel pivot table is a great way to organize and use data. After completing the steps above, Excel displays its usual Pivot Table design elements. The fields are shown for the external Access query output created. Select them as usual when designing a pivot table. There's a book referenced on Excel Pivot Tables that will be helpful to you. Make sure you choose "Sum of..." or "Count of..." in the Values columns at bottom right. I used Design > Report Layout > Tabular Design for the example shown.
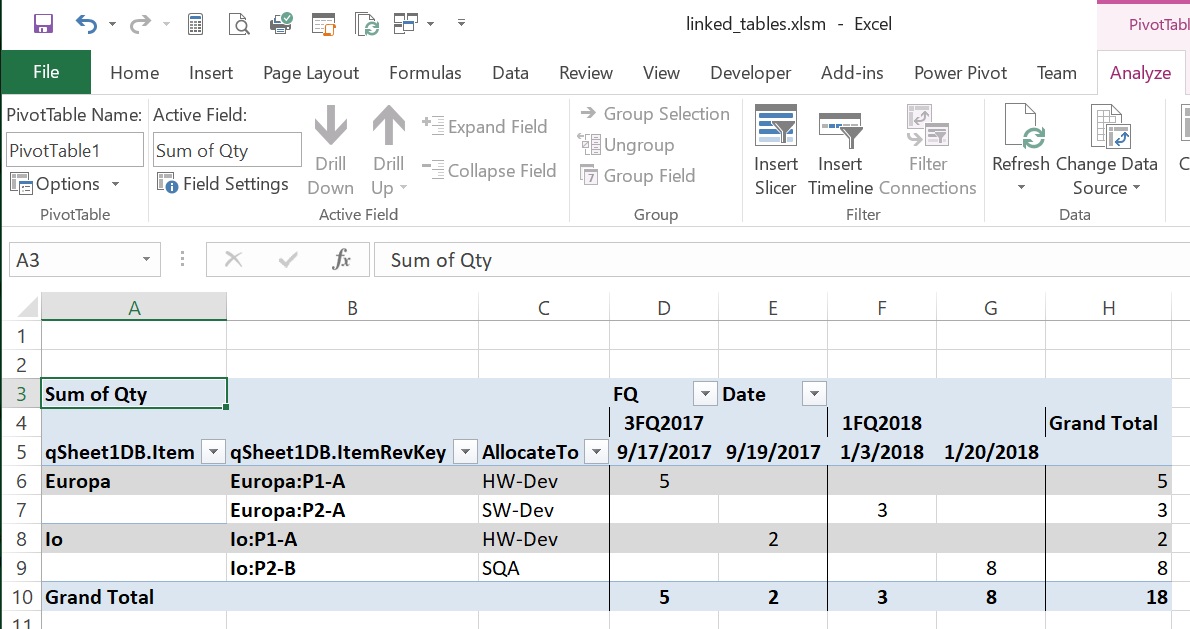
Pivot reports typically take a lot of tweaking to become persistently useful, particularly in sort order and in fields included. So don't be shy about evolving them. Often, the underlying query will contain a lot of fields and one query may support multiple pivot reports, for example sorted by program; by department; by user; by responsibility; by PO; by item number. And of course you can also build a pivot chart.
Above I gave examples of tables that might be used to handle budget and expense data. In that case, reports might show expenses by project; by Program Manager; by Date; by Planned vs. Actual; by Account; and permutations of these. Other implementations I've used have managed custom chip material by Lot, Wafer, and Process skew; Module Configuration (die, skew, package, substrate) by engineering test, qual test, characterization procedure; die yield and inventory by lot, wafer, base revision and metal revision, and skew; system configuration and silicon module configuration by system test and date and many more operational material planning and management needs. This data structure can support solutions to a wide variety of problems.
To debug the pivot, you can double-click Value entries (not Column Headings or Row Headings), and Excel will create a new worksheet containing all the query records that contribute to that value. The added sheet will be named something like "Sheet1". Make sure it shows that all the proper records are showing up and that there aren't records included that you're not expecting. It's a good idea to include in the query output all the line numbers from each table the query uses, so you can trace back through your queries to underlying data from the input tables. When you're through debugging, delete the added sheet.
Update Sequence
- Input data into the data tables in Excel. You can insert and delete rows between the orange lines, to add or delete records. You can add fields too, but the example shown doesn't take care to include them in the named range so you will have to do this manually. But it's probably much more likely you'll add records and pretty infrequent you'll add new fields.
- When all data has been updated in the Excel tables, save the workbook.
- In Excel, select Refresh All on the Data ribbon.
- Did you notice that you didn't have to open Access? (As long as you use Select queries, you won't have to open Access. If you use an Action Query (Make Table, Append, Delete, Update), you will have to open Access to execute that query so avoid that.)
This structure by itself is powerful in linking tables and handling variable-sized or non-flat problems. You can build much more sophisticated queries, calculate fields. This structure gets you entree into a very powerful world. The books listed will take you far.
Security
If you've put the Excel client worksheet and Access database file into directories that have previously been set up as trusted, you are all set.
To set up a trusted directory, Office Button (top left) > Excel (Access) Options (bottom right) > Trust Center > Trusted Locations > Add New Location...
If not in a Trusted Directory: When you re-open either the Excel file or Access files linked as above, a yellow security shield will be shown in the bar near the top of the app window. Click the associated button, and enable external access so the files can be linked.
Notes
The example files are available: Excel Workbook and Access Database (right click and "save target as...". Save as .htm or .html if it wants to save as a zip.). The note below is about how to re-link references between the Excel file and Access database on your computer once you have downloaded them. The workbook also contains code to refresh a pivot table on worksheet tab selection described below, and re-fitting of all columns to spec when a pivot is refreshed.
I usually create a macro to run queries. An example is shown in the example Access Database. SQL Server is a little more complex: the query output table must be deleted in the T-SQL script prior to running the make-table query.
One small complication with linked Excel and Access, the only one I've found that's complicated. If you drive a pivot table from a table in an Access database or SQL Server database, Excel provides SQL for the link. However, the addresses in the automatic link are absolute so if you move the database, the Excel pivot still points to the old location.
If you move the Access database, you have to re-link the Excel pivot table to point to the new database location. Here's some code that will change the links to point to the new location, targeted to Excel 2016.
If you move the Excel workbook client, you'll have to re-link the linked tables in Access. On the ribbon "Database Tools" tab, click "Linked Table Manager" and use the Linked Table Manager dialogue box. Make sure the box "Always prompt for new location" at bottom is checked so you can browse for the new location of the Excel client workbook.
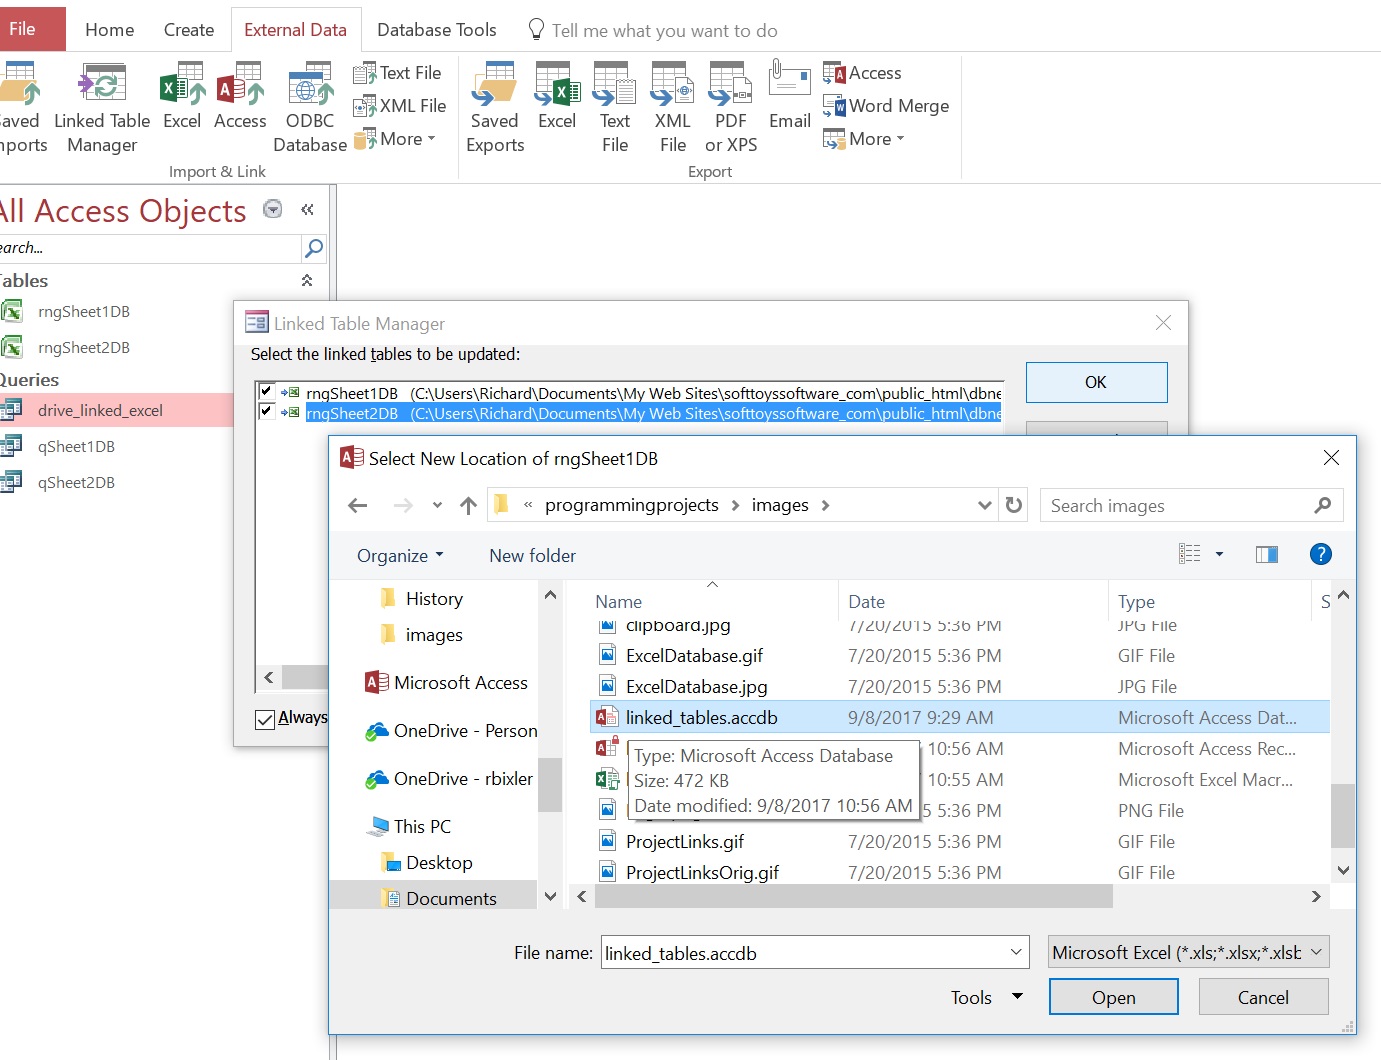
Of course if you move both the Excel workbook client and the Access database, you have to perform both re-link operations described just above.
Data used by Excel in an application linked as above uses a hidden Pivotcache in Excel to locally store the result of the database query. What if you need to perform local calculation in Excel using data from the query? Use a Query Table.
Set up a connection to the Excel file: Data ribbon > Get External Data > Existing Connection.
If you have a connection already, select it here. To create a new connection, click the "Browse for More..." button and browse for and select the desired Excel file and appropriate named range. To select an entire worksheet instead of a named range, select the entry shown as the worksheet name followed by "$" as in Task_Table$.
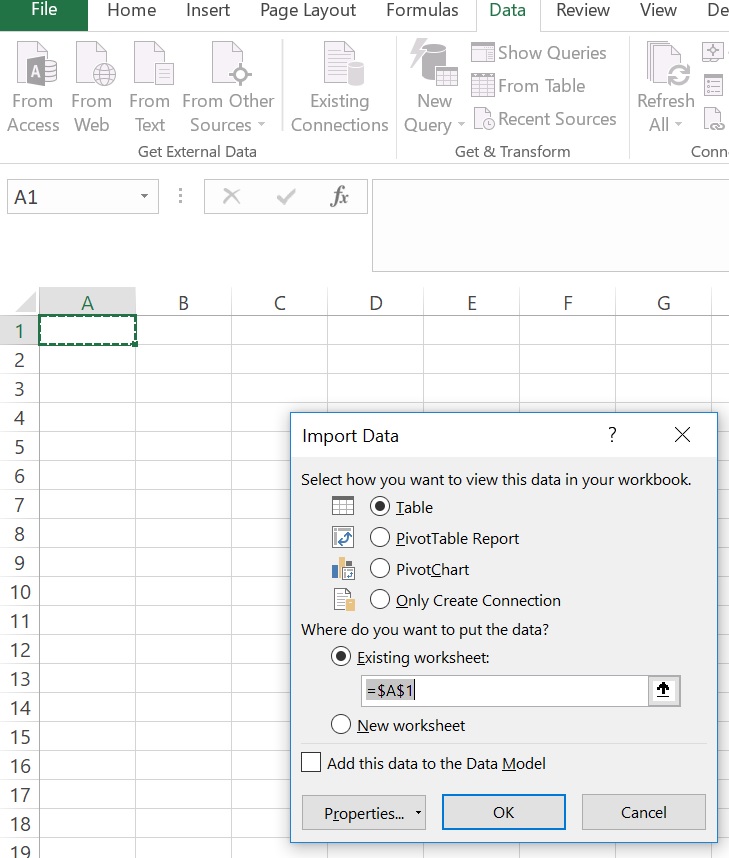
Select "Table"; or one of the other choices may be appropriate for a different application. Once you have the table in the Excel worksheet, add fields at the right side of the table by typing their titles in a cell just to the right of the title bar, and enter a calculation below it using Structured Notation. Then the calculation will propagate and recalculate, as the table is refreshed.
Add the connection to the connection update list, so it will be updated by the same code to re-link Pivot Tables if their MS Access source is moved.
I would prefer to have pivot tables update each time they become visible. This avoids using data in a table for which you forgot to click the code to update the pivot tables on a worksheet when you click the worksheet tab.
Create and Call QUERYs from Excel Using a Data Connection
Instead of linking a series of QUERYs that JOIN one table at a time, you can do it in a single QUERY. You can do that in MS Access by building the QUERY in MS Access as a stored QUERY as the steps show above on this page, or you can do it directly from a QUERY within Excel by including the SQL statement in the Connection. The form of the QUERY could be derived from the example below.
To build and call a QUERY of an MS Access database from within Excel, the QUERY must be written in SQL. Build a string containing the full QUERY as text. Create an Excel Data Connection, set its <Command Type> as "SQL" and <Command Text> to contain the SQL string with your QUERY. The form of a SQL QUERY to JOIN multiple tables using MS Access is shown in the following figure.
SELECT rngAlloc.*, rngBOM.*, rngBuilds.*, rngDates.*, rngElements.*,
        [Qty]*[SubQty] AS QtyExt,
        [Qty]*[SubQty]*[SubCost] AS CostExt
FROM (((rngAlloc
LEFT JOIN rngBOM ON rngAlloc.AllocRevKey = rngBOM.BOMItemKeyIn)
LEFT JOIN rngDates ON rngBOM.BOMItemKeyOut = rngDates.SchedItemRevKey)
LEFT JOIN rngBuilds ON rngDates.SchedItemRevKey = rngBuilds.BuildRevKey)
LEFT JOIN rngElements ON rngBOM.BOMItemKey = rngElements.ElementItemKey;
This figure is for MS Access, in which you have previously constructed the Linked Tables linked to Excel (rngAlloc, rngBOM et al). The syntax is a little different than this example for SQL Server because Linked Tables are implemented differently there. See linkexcelsqlserver.htm for steps to use Excel with SQL Server.
This scheme for using MS Access is similar to the scheme for using SQL Server. MS Access Linked Table setup in the examples above is done from the MS Access UI, not in SQL, so the tables exist in Access when the example QUERY is performed so table import from within the SQL QUERY is not required in this case as it is in the SQL Server example. In the SQL Server example, we show import of Tables from Excel using a Linked Server or OPENROWSET called by the QUERY.
-
Use the Data Connection to Drive a Pivot Table in Excel.
Create and Call Stored QUERYs in MS Access from Excel Using a Data Connection
Despite documentation on CREATE PROCEDURE and DROP PROCEDURE to build and drop stored QUERYs in MS Access using SQL, I have been unable so far to get these to function in MS Office 365 2016. So I've sidelined this section until I can work out a working structure. The documentation for CREATE PROCEDURE shows VBA that can Create and Drop a QUERYdef.