
MEET FEATURE REQUIREMENTS, SCHEDULE, and BUDGET! Consulting available to teach your organization to apply this methodology and tools for powerful quantitative management of your business processes.
- Instruction of your staff at your site, using courseware, application example, and a functional template.
- Mentoring your key staff on an ongoing or periodic basis, on these tools or on Quantitative Program Management.
- Contracting or Employment in your organization on specific topics.
Check out my YouTube Channel: Power Operational Intelligence
Now Live! Overview, Structure, Task Data, Table Design, SQL Server, and Re-Linking now showing.
Video courses covering material on this website, and more, are presented in the playlists.
Code snippet links at YouTube Code Snippets. Twitter at @poweroperation1, #poweropi, #poweroperationalintelligence.
Subscribe on YouTube, and click the "Notification" Bell icon to be notified as content is published.
Using Excel with a DatabaseFlat Excel spreadsheets, some expressed as tables, are commonly used to represent, analyze and manage business problems. But there are more powerful ways to use Excel: connecting Excel Tables to a Database environment, to add the power of QUERYs and JOINs to combine the Tables to drive Pivot reports, Pivot charts, QUERY Tables, and PowerBI graphical elements. This capability has been available for years using MS Access and SQL Server. In recent years, Microsoft have added PowerQuery to Excel, as well as PowerBI Desktop, with intent to make Excel-with-a-database for Business Intelligence ("BI") a self-service proposition, available to ordinary mortals. This website is about Power Operational Intelligence ("PowerOpI"), a use of Excel as a data source (among others) initially developed with MS Access and SQL Server, and extended to PowerQuery. These are explored as tools for Program Management of complex projects, in posts on Silicon Valley Project Management, and collected here as well as on this site for convenient viewing on this site. PowerOpI provides automation for local and multi-user distributed use, supporting:
PowerOpI Downloads Each of the PowerOpI Framework distributions below focuses on one of the environments addressed by PowerOpI (Power Query, SQL Server, and MS Access) and they all solve the same two problems: Description, aggregation and explosion of a Program Management logistics problem using JOINs, and aggregation via UNION of multiple similar datasets. Data sources are based on Excel Structured Tables, and use INDEX/MATCH, SUMIF, XLOOKUP and related functions. Scheduling is done in MS Project and imported into the database solution. Visualization can be done using Visio, and examples are included in the distributions. Within each, QUERYs for JOIN and UNION are demonstrated in several ways appropriate to its database environment (Direct Query, Stored Query/Stored Procedure, and in some cases using Linked Files, Linked Servers, or OPENROWSET) and using SQL, M, and M with embedded SQL. The examples demonstrate structures that have been shown to be necessary and sufficient in the Author's experience, to handle pretty large and complicated projects. The methodologies can be extended to address different problems than illustrated; the concept of using Excel with a Database is very general and the tools are much more powerful when combined. Common commercial tools do not seem to be available to address the combined complexity of problems addressed. On the whole, commercial tools operate as "black holes", tied within specific domains and unable to address cross-functional requirements and practices. The answer is to combine tools specialized for domains, to aggregate their power. The methodologies of each environment can be compared. Differences among the environments are compared in a table farther down the page; such differences generally affect ability to distribute and maintain solutions among multiple client users in an organizational cross-functional project, or to focus on single-user data mining and analysis.
The Framework is available in a free version that demonstrates and fully supports M with PowerQuery, and is also available in a consulting-required version that also supports SQL with PowerQuery, SQL Server, and MS Access for variations of distribution and maintenance characteristics. The structure is the same for both versions, with differences in provided Tables, QUERYs, and Connections.
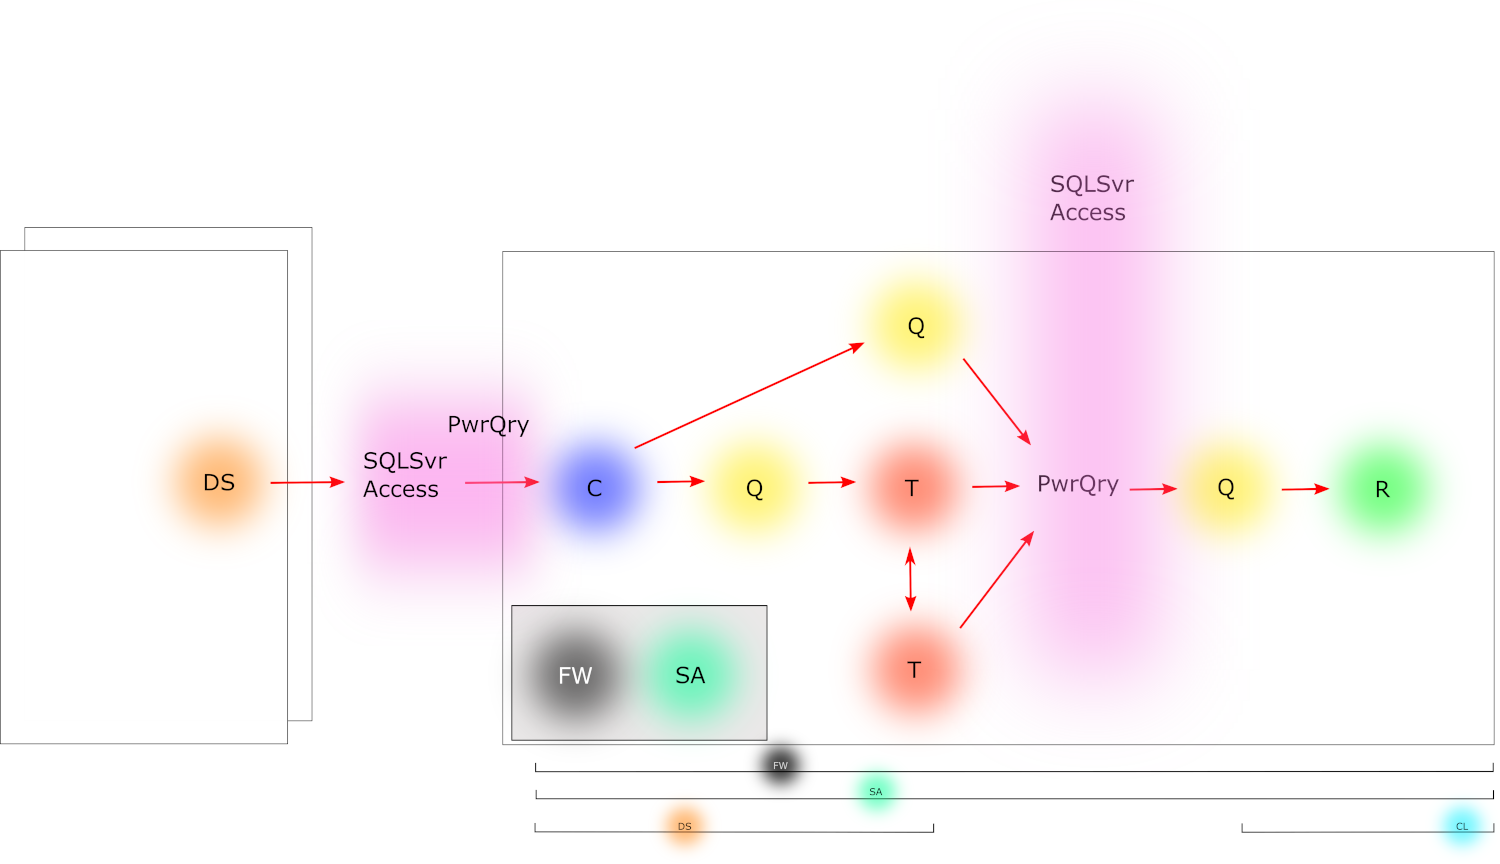
Framework and Standalone The structure of the Framework is shown in the image just below. The Framework contains Reports, Tables, QUERYs, and Connections. In the PowerQuery version distributed, these objects are configured as a Standalone tool, containing both Data and Client objects. Report objects (Pivot Report, charts, and Tables) are driven by PowerQuery QUERYs, that pull data from Tables, via PowerQuery QUERYs. Table objects within the Framework workbook are directly accessed by PowerQuery. Another Table is provided in an external file accessed by a separate QUERY. PowerQuery itself is contained within the Excel environment; if SQL Server or MS Access were used, as in the Framework version supporting SQL, those database engines would be outside the Excel environment, to be accessed through Connection objects.
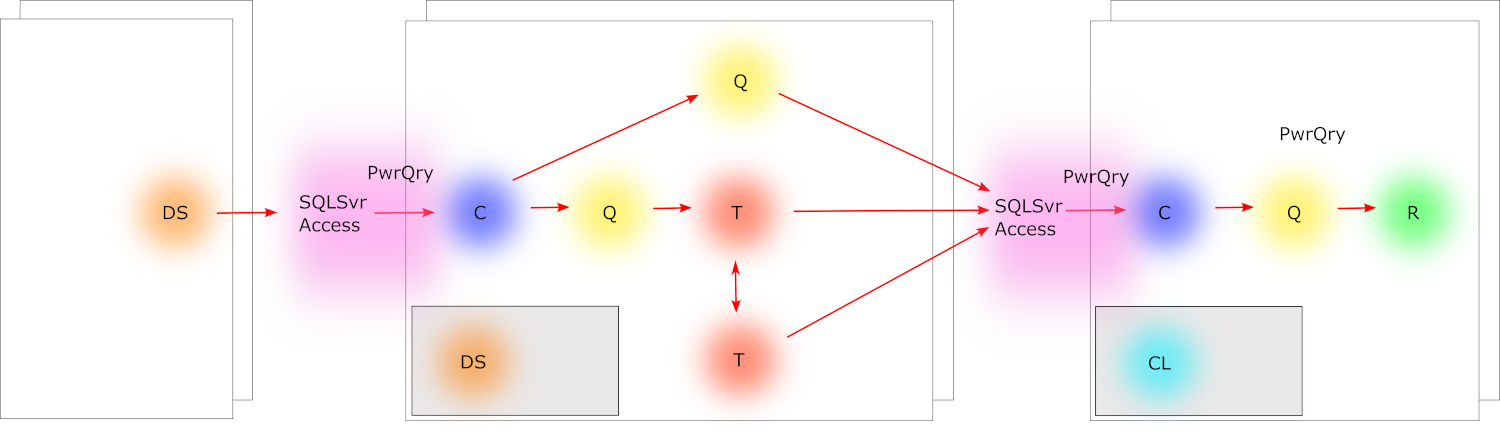
These objects can be configured differently as you create them. They would be created to represent your project and product structures, using structure mimicking the structures of the Framework objects. They could be created by cloning and modifying objects provided in the Framework distribution, or they could be directly created in the provided Connection and QUERY editors, or they could be created using native PowerQuery and Excel functionality. The Framework objects can be created and connected in different configurations too. In the image above, the left-most Data Source could be an instance of a PowerOpI Framework configured as a Data Source, or any of the files or database types that can be connected to via PowerQuery, SQL Server, or MS Access. The image below shows how Data Source function can be separated from Client function, for distributed use. This can include use of multiple Data Sources interconnected with multiple Clients. Differences in characteristics of distribution among PowerQuery, SQL Server, and MS Access are compared in the table below.
Here is a depiction of top-level architecture implemented by the Framework. Other configurations derived from this are also supported, distributing one or more Data Sources with one or more Clients using a variety of database structures via MS Access, SQL Server, and PowerQuery. 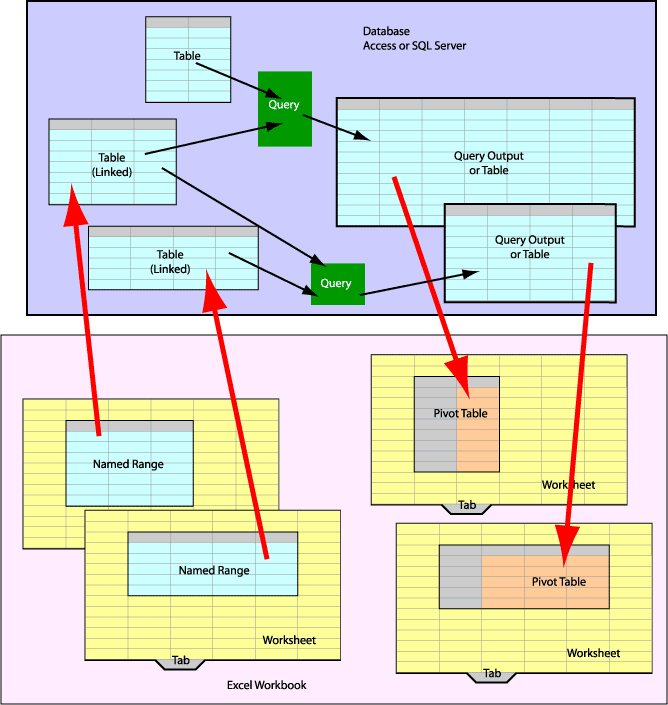
Comparing MS Access, PowerQuery, and SQL Server, as used with PowerOpIWhich Database environment to use is determined by
Here's a comparison of those and related factors.
The Zen of Excel Pivot TablesMost books covering Excel Pivot Tables pretty much focus on construction of Pivots. I use Pivots every day to organize and manage data critical to planning and operation in my function. That data changes constantly, new kinds of data are added, and new reporting is needed. I've found there is a level of design above the technical construction of the Pivot Table that helps make the Pivot Tables themselves more straightforward to create, and helps with better evolution and reporting. I think this embodies the Zen of Excel Pivot Tables. Integrating Microsoft Project with Excel and Visio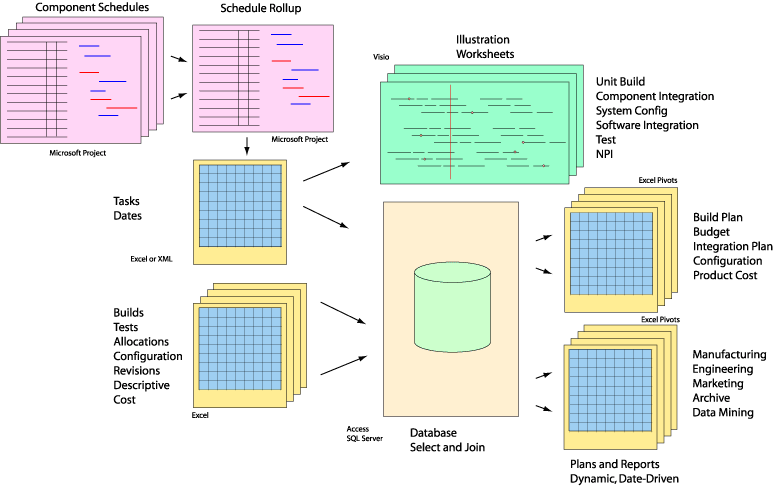
Microsoft Project is widely used by Program Managers to represent a project execution plan and to quantify a schedule. Project can output dates that can be integrated into a Logistics/Build Plan to tie together dates with quantities and configurations, and from that can drive a Finance/Budget plan with date-dependent records describing expenditures, suppliers, build-items and so forth. Article: Project Links. INDEX/MATCH and SUMIF with Excel Structured Tables
Excel Structured Tables allow Excel to provide revolutionary functionality like a database with PowerBI, or with a SQL database as described in Excel-Database, or to some degree among multiple tables within Excel.
Excel INDEX/MATCH/MATCHStructured Reference addresses columns by their column name. Used with INDEX and MATCH functions or with the SUMIF function, data in tables can be addressed by content, essentially allowing Excel to find its own way around a worksheet. Structured Reference can address multiple tables in a workbook by name, so data can be addressed by content throughout a workbook. The combination of functions INDEX and MATCH allows for lookup, and SUMIF provides aggregation of values among multiple records.
The INDEX function can be used as:
MATCH syntax is:
Putting INDEX and MATCH together: The 0 Exact value specifies "exact" match; choices include ≤, =, and ≥, specified by -1, 0, and +1. This combination of functions behaves much like VLOOKUP or HLOOKUP, except that this lookup can be up, down, left and right, and column and row order don't matter. Excel SUMIFINDEX/MATCH can return a single value, like the serial number of "R730 Server" for system "HW-Qual". To return the total number of Ethernet cables associated with all RNICs distributed among several servers requires a function that can find all records for "RNIC"s and add up the number of "Ports" in those records. (Start thinking of table rows as Database Records). That function is SUMIF.
SUMIF is used as: The sum of the values in column "valueColumn" for all records in table "sourceTable" containing the value of variable "keyValue" in column "keyColumn" is returned. Other functions work similarly with Structured Tables and Structured References. In this type of application, some more that are particularly useful include SUMIFS, COUNTIF, COUNTIFS, MAXIFS, and IFS which allow you to sum, to count, and to choose based on one or multiple criteria, using Structured Table fields as arguments. They function just as the description of SUMIF just above; type in the table name followed by a "[" and Intellisense will drop down a list of field names to choose. This article shows use of INDEX/MATCH and SUMIF with Structured Reference, in the Excel user interface. Those constructs can also be used from within VBA as described in Structured Reference using VBA, Excel Object Model, Application.WorksheetFunction, and constructed Structured Reference expressions. The article linked just above also describes use of Excel function TEXTJOIN, which is useful for constructing a SQL string (see page Link Excel with SQL Server). TEXTJOIN is available as of Excel 2016 and is now available in VBA as a WORKSHEETFUNCTION. A function called VBTEXTJOIN is described in the linked article, that provides TEXTJOIN function from within VBA, is usable in the Excel user interface, and available in Excel current and prior editions. XLOOKUP Used With Excel Structured Tables, Compared With INDEX/MATCH/MATCHExcel XLOOKUP(2019 August 30, updated 4 November and 2020 April 18) Microsoft introduced function XLOOKUP as a functional enhancement to VLOOKUP, announcement on Microsoft TechCommunity, and reference: syntax: itemRange = XLOOKUP( itemValueSought, lookup_array, return_array, [if_not_found], [match_mode], [search_mode] ) Example: For example, an XLOOKUP function used in a "destination" table, to which a single value is returned to each destination table record from a "source" table, illustrating use of XLOOKUP within Excel Structured Tables: =XLOOKUP( [@Key], tblItemData[Key], tblItemData[Cost] ) XLOOKUP uses a value in destination table records column "Key" to look up item records within source table "tblItemData" with matching value in their column "Key", to return a value from that record in column "Cost". lookup_array:
return_array:
if_not_found:
match_mode:
search_mode:
XLOOKUP removes the column-order requirement inherent to VLOOKUP. Excel INDEX/MATCH/MATCH ReviewSince many users of VLOOKUP will consider moving to XLOOKUP, XLOOKUP will also be considered as an alternative to INDEX/MATCH/MATCH, which is considered by many to be "complicated". That's not quite so simple a comparison for applications using INDEX/MATCH/MATCH in Excel Structured Tables, needing to do 2-dimensional lookups using Structured References to define function arguments. The INDEX/MATCH/MATCH structure used in the Excel user interface with Structured Tables and Structured References, as described in the preceding section on this page, looks like:
=INDEX( tableName,
where tableName is the name of the source Table from which values are to be looked up (and which could be a separate Table, or the same destination Table initiating the lookup). inColumnName names the column/field to be searched for a row matching rowItemSought. rowItemSought and columnNameSought could be literal strings, references to [@fields] in the same record as the INDEX/MATCH/MATCH expression, string specifying the tableName #Headers name for the field/column containing the value to be returned, or reference to a cell or named value elsewhere in Excel. These two arguments address the desired data as values of its attributes rather than by a hard address thereby implementing location-independence. The first MATCH function determines row index in a searched column/field matching the value of rowItemSought; the second MATCH determines the column index of the return column named as the value of columnNameSought. The outer INDEX function uses the row index and column index within a table named as the value of tableName, and returns the value of the specified Table entry. Using XLOOKUP to achieve the same functionality as INDEX/MATCH/MATCHThe analogous XLOOKUP structure used in the Excel user interface with Structured Tables and Structured References as above looks like:
=XLOOKUP( [@rowItemSought], tableName[inColumnName],
using the same definitions for the variables named as described for INDEX/MATCH/MATCH and showing some as references to [@same-row_fields]. The inner XLOOKUP returns the return_column range for columnNameSought, from which values will be returned. The outer XLOOKUP determines the row containing a matching rowItemSought value within the source Table column named inColumnName, and completes the lookup into the return_column, returning the value from its row containing the matching rowItemSought value. (Examples in announcement documents used cell addressing, so my effort was to determine how to use the functions with Structured Tables and Structured Reference.) Example of XLOOKUP used as INDEX/MATCH/MATCH: For example, XLOOKUP implementation of functionality similar to that described for INDEX/MATCH/MATCH. In that construction, the second MATCH function determines the appropriate field from which to return the value. That field name can be specified by reference, and is not necessarily embedded into the construction. An analogous construction using XLOOKUP:
=XLOOKUP( [@Key], tblItemData[Key],
Behavior of the ItemSought parameter: This structure adds an internal XLOOKUP, similar in function to the second MATCH parameter in INDEX/MATCH/MATCH, to find source table field named as ItemSought from which to return values. In this example, the Key parameter specifies source records to find in a Structured Table named tblItemData. The ItemSought parameter specifies, either by value or by reference, the name of the column from which values will be returned from those records in the source Table by this construction. The ItemSought parameter can be specified as:
My interest is in returning a single value from a Structured Table, to be used within a calculation in a field within a Structured Table. There are more, broader, uses of XLOOKUP that can return a more complex range as their result. XLOOKUP Returns a Range, not a Value (!!!)*** (Updated 12 June 2020) I don't see real advantages in mapping XLOOKUP onto INDEX/MATCH/MATCH. Of course it works for single-value return as shown, but I find INDEX/MATCH/MATCH more intuitive. However, the really big difference between them is that XLOOKUP returns a RANGE, and that opens up a different world of uses for XLOOKUP. (Note that the values returned in the Range from XLOOKUP may be selected from non-contiguous cells in the source, that meet the selection criteria.) You could wrap the XLOOKUP function inside a SUM function to summarize or aggregate values in the RANGE returned by XLOOKUP: That's effectively SUMIF capability. In fact, you could wrap it with any function taking a range argument (e.g. Max, Min, Average, some index/search function, ...); or in VBA, include it (using Application.WorksheetFunction) in any calculation you program. That gives you versatile "CalcIF" capability. The "IF" function is controlled by the itemValueSought and lookup_array arguments in any calculation you program. So the "CalcIF" functionality works in both the Excel UI and in VBA. Microsoft have already provided SUMIF, AVERAGEIF, COUNTIF, and corresponding ...IFS functions. Those can be extended for complex selection to work on any non-contiguously-selected range of values by using a helper field construction, described just below. But there may be other functions for which that would be useful, and the conditional "CalcIF" functionality of XLOOKUP can also be useful to functions you provide in VBA. As an example, I need to construct a SQLCommandText string in a a field in each record in a destination Excel Structured Table by concatenating text values from a specified column in a another source Structured Table. The name of the column to be concatenated is specified in each destination record, by column-name contained in a field in that destination record. So the column-name field in each destination-table record specifies the name of a source-table column from which I want to concatenate all contained values back into the destination-table SQLCommandText field. I can't embed the column-name into the concatenation expression, because I want to enable my user to choose any SQL source table column-name, into each destination-record source-column-name field, without forcing them to update my function calls. So here's what my function call looks like in the destination table, using TEXTJOIN to concatenate a column with XLOOKUP to give it the named column from the source table:
=TEXTJOIN(CHAR(32) & CHAR(10),TRUE,
XLOOKUP returns a range matching the source-table column tblSQL[SQLName] whose name is specified in destination-table field @SQLName and matched in tblSQL[#Headers]. From that, function TEXTJOIN concatenates all values in the returned Range. By the way, it's good practice to wrap all this with an IFERROR function just in case... consider returning a null field "" or else "-" on error. A note on helper fields for record selection: If you need control on which elements are selected to participate in the wrapper calculation, you can create a structured-key "helper field" (e.g., "[@field1] & ":" & [@field2] & ":" & String" etc.) to help XLOOKUP select Table elements as you wish. Excel XMATCHMicrosoft also announced a function XMATCH as a functional enhancement to MATCH, reference: syntax: itemIndex = XMATCH( itemValueSought, lookup_array, [match_mode], [search_Mode] ) lookup_array:
match_mode:
search_mode:
Consider also that the construction INDEX/XMATCH/XMATCH provides new lookup capability, given the optional wildcards of match_mode, and search order options of search_mode in each instance of XMATCH. Finally, Microsoft provides both XLOOKUP and XMATCH in Application.WorksheetFunction, making them directly callable in VBA. Assessment: XLOOKUP/XMATCH vs. INDEX/MATCH/MATCHIt seems that using XLOOKUP in Structured Tables is more or less the same capability and complexity as using INDEX/MATCH/MATCH.
(Updated 12 June 2020) But the return of a Range by XLOOKUP is great new functionality, allowing operation on a selected set of contiguous or non-contiguous members. This function can be provided to other functions operating on a Range, provided by Microsoft or by your VBA and greatly leveraging the functionality of those functions. What if your users are on an earlier version of Excel that doesn't include XLOOKUP?'XLOOKUP is available in Excel AFTER Excel versions 2016 and 2019, so in some cases you can't count on availability of XLOOKUP. Here's a limited-function emulation of XLOOKUP to return a Column with a specified Name from a Structured Table. Function vbatableXLOOKUP allows selection of a column to return by naming the column in a table field, rather than hard-coding the name in each function call in the table. This is so that the intended column can be chosen by drop-down, or calculation. Excel LAMBDA and LET FunctionsI needed to determine the third and fourth Wednesday of specified months, to synchronize invoicing with a government payment schedule. I looked for functions to do that and found some that partially worked but would only return the third Wednesday and fail to find other dates specified. I decided to use a LAMBDA expression to do that. There are good references describing how to write a LAMBDA function; for example https://peltiertech.com/calculate-nice-axis-scales-with-let-and-lambda/. LAMBDA function lets you create a function, with arguments specified in the call (as value, cell reference, named reference, Structured Table field reference); and return calculated value of an expression that uses those arguments The LAMBDA function is implemented from functions available on a worksheet, instead of VBA. LET function lets you collect arguments (as values, cells, named references), name them, and name and return value of an expression that uses those arguments. LET functions may be used within LAMBDA functions, referencing each other via arguments and named value returns, to perform sequential work to be used in the value returned by the LAMBDA function. Here's an example LAMBDA, to find the Nth specified weekday in a specified month and year; it can also find in reverse from the end of a month. So examples include fourth Thursday in November, last or next to last Friday in a month. Following that are some helper functions that convert back and forth between day and month name and abbreviations; and month number in year, day number in week. fnTargetInstanceDate
=LAMBDA(tgtMonth,tgtYear,WkdayInstance,WkdayTarget,
    IF(WkdayInstance > 0,
        LET(
                IndexDate, DATE(tgtYear, fnMonthNameToNumber(tgtMonth), 8),
                IndexDate - WEEKDAY(IndexDate - fnDayNameToNumber(WkdayTarget))
               +(WkdayInstance-1)*7
         ),
           IF(WkdayInstance < 0,
               LET(
                       IndexDate, DATE(tgtYear, fnMonthNameToNumber(tgtMonth)+1, 1),
                       IndexDate - WEEKDAY(IndexDate - fnDayNameToNumber(WkdayTarget))
                      +(WkdayInstance+1)*7
                ), 0
           )
    )
 )
([@PaymentMonth],[@PaymentYear],[@TgtWkdayInstance],[@WeekdayTargetName])
This function can be specified in the Excel Name Manager as a named value which will execute the function when called. =LAMBDA(tgtMonth,tgtYear,WkdayInstance,WkdayTarget, IF(WkdayInstance > 0, LET( IndexDate, DATE(tgtYear, fnToMonthNumber(tgtMonth), 8), IndexDate - WEEKDAY(IndexDate - fnToDayNumber(WkdayTarget)) +(WkdayInstance-1)*7 ), IF(WkdayInstance < 0, LET( IndexDate, DATE(tgtYear, fnToMonthNumber(tgtMonth)+1, 1), IndexDate - WEEKDAY(IndexDate - fnToDayNumber(WkdayTarget)) +(WkdayInstance+1)*7 ), 0 ) ) ) NOTE no argument string at end of expression above. Need argument string to execute in cell; Drop argument string for named expression.
Here's how to call it: The function uses helper functions, fnToDayNumber and fnToMonthNumber, which are also LAMBDA functions and are specified below with similar functions to give a complete set of conversions. In general, each can be called with day names or month names as appropriate, such as "September", "Sept", "Sep", "9" or "Tuesday", "Tues", "Tue", "3". The functions return strings. They also return identity values such as a call to long version of "September" returns "September"; this is so that the functions can be used without knowing whether a conversion is needed or not; and accepting the argument in several forms anyway.
Explanation of the function: The calculation is slightly modified to count back from the end of the month. The last day varies from month-to-month (28, 29, 30, 31) but can be determined as 1 day prior to the first of the NEXT month, a reliable calculation. The last instance of a targeted weekday will occur in the 7 days prior to the first of the next month; and multiples of 7 can be subtracted to find the target weekday in prior weeks. The function counts backward from the end of month if the argument is negative; -1 indicates the last instance of a specified weekday, -2 is the week prior to the last, etc. Here are month and day conversion functions that are useful in date conversions. fnMonthNameToLong
=LAMBDA(Argument,
    LET(
        MonthNameToLong,Argument,
        IFERROR(
            SWITCH(
                IF(ISNUMBER(Argument),TEXT(Argument,"#0"),Argument),
                "January", "January", "Jan", "January", "1", "January", "February", "February",
                "Feb", "February", "2", "February", "March", "March", "Mar", "March", "3", "March",
                "April", "April", "Apr", "April", "4", "April", "May", "May", "5", "May", "June",
                "June", "Jun", "June", "6", "June", "July", "July", "Jul", "July", "7", "July",
                "August", "August", "Aug", "August", "8", "August", "September", "September",
                "Sep", "September", "Sept", "September", "9", "September", "October", "October",
                "Oct", "October", "10", "October", "November", "November", "Nov", "November", "11",
                "November", "December", "December", "Dec", "December", "12", "December"
            ),
        "-")
    )
)($I$28)
NOTE argument string at end of expression above. Need argument string to execute in cell; Drop argument string for named expression.
fnToMonthNameLong NOTE argument string at end of expression above. Need argument string to execute in cell; Drop argument string for named expression. =fnToMonthNameLong($I$17)
fnToMonthNameShort NOTE argument string at end of expression above. Need argument string to execute in cell; Drop argument string for named expression. =fnToMonthNameShort($I$17)
fnToMonthNumber NOTE argument string at end of expression above. Need argument string to execute in cell; Drop argument string for named expression. =fnToMonthNumber($I$17)
fnToDayNameLong NOTE argument string at end of expression above. Need argument string to execute in cell; Drop argument string for named expression. =fnToDayNameLong($I$33)
fnToDayNameShort NOTE argument string at end of expression above. Need argument string to execute in cell; Drop argument string for named expression. =fnToDayNameShort($I$33)
fnToDayNumber NOTE argument string at end of expression above. Need argument string to execute in cell; Drop argument string for named expression. =fnToDayNumber($I$33)
fnToOffsetMonth NOTE argument string at end of expression above. Need argument string to execute in cell; Drop argument string for named expression. Determines prior or subsequent month number, respecting month numbering 1-12. Accepts frmMonth long, short or 1-12, and tgtOffset any value positive or negative. Returns toOffsetMonthNumber as number 1-12; use fnToMonthNameLong(fntoOffsetMonth()) etc. to map month number to month name. If input frmMonth is invalid or outside of monthNumber 1-12, fnToOffsetMonth returns value zero which can be formatted as "-" using Excel Accounting format; or formatted as red 0 for example by Conditional Formatting. NOTE argument string at end of expression above. Need argument string to execute in cell; Drop argument string for named expression. =fnToOffsetMonth([frmMonth],[tgtOffset]) Alternate date-function using spreadsheet functions: =fnToMonthNameShort(MONTH(DATE(2000,fnToMonthNumber([@frmMonth])+[@tgtOffset],15))) Data VisualizationWhen linked as shown on the projectlinks page, a Microsoft Visio image will illustrate the MS Project plan. 
Now you have the skills to put together really powerful and customizable tools to manage project logistics and financials, using Excel with a database to use JOINs linking Excel tables with data from other programs. As the database develops and changes to reflect your execution history and plan adjustments, you will find that you can use data-mining to get information to better manage. This comes in the form of well-designed pivots to organize and summarize data; SQL SELECT and JOIN to combine related datasets and perform complicated data selection and organization. And Data Visualization which will help you understand the data as you develop management structure, and to explain the data-driven management structure to others.
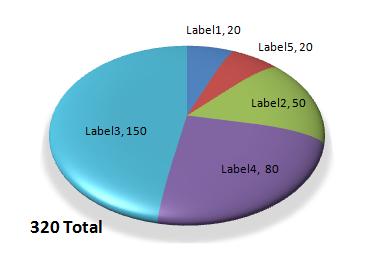
On Data Visualization, I gave a reference to Tufte below, a key figure in Data Visualization. Also see Excelcharts.com by Jorge Camoes, and John Walkenbach's The Spreadsheet Page. Stephen Few is a key mentor in data visualization and runs Perceptual Edge, a blog focusing on Visual Business Intelligence. My charts haven't appeared yet on Kaiser Fung's Junkcharts blog. But you should go there, to see many examples and discussion of charts that do or don't work. I'm sure I will get there, though, because I have certainly used pie charts, which are not popular among Visualization experts. Just make sure your analysis remains faithful to the data and that the data, rather than your presentation method, remains the story. And even pie charts have their use, depending on the point you are making. Pies are good at illustrating relative proportions of component parts within a whole collection of parts. You could compare variables "sliced" within separate pies by scaling the areas of each of the pies. Knowing that two pies would have areas a = π * r2 and A = π * R2, you would make the area A of one pie comparable to area a of the other pie and scaled by k such that A = k * a, by setting R = r * √ k . Having said all that, and for proper use only, here is the One Pie To Rule All Pies. This Pie Chart is done in Excel, but you won't find it in the menus. Nobody else will have these graphics, and the brilliance of your analysis will pop right off the page! Article: Pie Chart. Connected Chart LabelsYou can put a label on an Excel chart tied to data and computation on a spreadsheet. For example, you can reference assumptions, or a total that may not be displayed explicitly in the chart data such as a total on a pie chart. Article: Connected Chart Labels. Using Excel Tables in VBAResults of a database QUERY may be returned to an Excel Table to be processed by VBA code running in Excel. Jan Karel Pieterse has a very informative article on his JKP Application Development Services site describing code for using Excel Tables, followed by useful Q&A. See The Spreadsheet Page. |
|||||||||||||||||||||||||||||||||||||||||||||||||||||||||||||||||||||||||
Programming ReferencesMicrosoft Excel
Best programming reference I've found. In depth, advanced. Focused on VBA programming.
Definitive on design of Excel applications including VBA and Excel constructs. Best description of many useful techniques such Dynamic Lists.
Go-To book describing use of DAX, PowerQuery, Power BI and Power Pivot in Excel 2010 - 2016.
Covers Excel Business Intelligence basics, and in particular covers interaction between Excel and SQL Server.
Pivot tables and VB are the most powerful features of Excel... Dives into PowerPivot and BI as well as classic Pivot Tables.
XML
Old, and XML is now implemented in .NET, but this is a good overall reference and much translates to use in .NET. Microsoft Project
Excel-based Gantt by Craig Hatmaker. Data Visualization
The point of a quantitative graphic: the revelation of the complex. Charting complex information can be an art form, quantitatively illustrating regular structure of diverse phenomena. This is what shows true understanding, much more powerful than just illustration or enumeration. Also see Excelcharts.com for a blog and tutorial on Excel data visualization using charts and dashboards. Tufte meets Excel, as they say on the site. Monte Carlo SimulationIt is frequently useful to build a model using stochastic variables, and to use Monte Carlo simulation to create and analyze the range of probable outcomes. Following are add-ons for use with Excel and Project. Crystal Ball was originally developed by Decisioneering.
Palisade provides several more analysis tools for Excel including StatTools, Evolver, and PrecisionTree. More Links
Microsoft AccessAccess is well-integrated into MS Office and is fully-capable for many user database applications. Includes full UI support and VB. You can use SQL, but for many applications it is not needed. Access is a member of Microsoft Office.
This one is a non-intimidating introduction.
QueryStorm
A nice way to use SQL and C# from within Excel. Professional and Runtime licenses full-featured for commercial use. Free license available for non-commercial use only with local database.
Microsoft SQL ServerSQL Server is a full-function database. It can be integrated with Excel, or most frequently used with a programmed client such as a .NET program. You need SQL for this. SQL Server is a separate product, but SQL Server Express is free.
Broad description of programming use of SQL Server 2019. This is an excellent Go-To book on setting up and using the primary characteristics of SQL Server including queries and joins; data update, types and functions; database structure design and setup using SQL; views, scripts and stored procedures; transactions; security logins, permissions and roles; XML; and blobs.
T-SQL, an extension of ANSI SQL implemented in SQL Server but not in Access, adds significant power to SQL Server.
ADO.NETADO.NET provides services for programmed connection between a database (Access, SQL Server, or other) and a client (Excel, or a .NET client program).
Programming Languages: C/C++A little off-topic, but as long as we're recommending books, here are two books on C/C++ for hardcore programmers. I have read quite a few books on C/C++ and these were the best by far. Read the books, stick with it, do the problems, and you WILL know how to use the languages. These are later editions than I used.
Design PatternsStanding on the shoulders of those who have been there before you:
|
|||||||||||||||||||||||||||||||||||||||||||||||||||||||||||||||||||||||||
Web Design EnvironmentsDevelopment Tools and Client Side
Server-Side Environments
Database
|
|||||||||||||||||||||||||||||||||||||||||||||||||||||||||||||||||||||||||
 Excel 2007 VBA
 Professional Excel Development
 Power Pivot and Power BI
 Microsoft Business Intelligence Tools for Excel Analysts
 Microsoft Excel 2019 Pivot Table Data Crunching
 XML Application Development with MSXML 4.0
 Microsoft Office Project 2007 Inside Out
 The Visual Display of Quantitative Data
 Oracle Crystal Ball for Excel
 Access 2007 Inside Out
 Access 2003 Inside Track
 Microsoft Excel and Access Integration: With Microsoft Office 2007
 SQL Server 2019 for developers
 Beginning T-SQL with Microsoft SQL Server 2005 and 2008
 Microsoft SQL Server 2008 Programming
 Murach's ADO.NET 3.5, LINQ and the Entity Framework with VB 2008
 Applications Programming in ANSI C
 Object-Oriented Programming in C++
 Design Patterns: Elements of Reusable Object-Oriented Software
 PHP and MySQL for Dynamic Web Sites, Fourth Edition